Blog posts
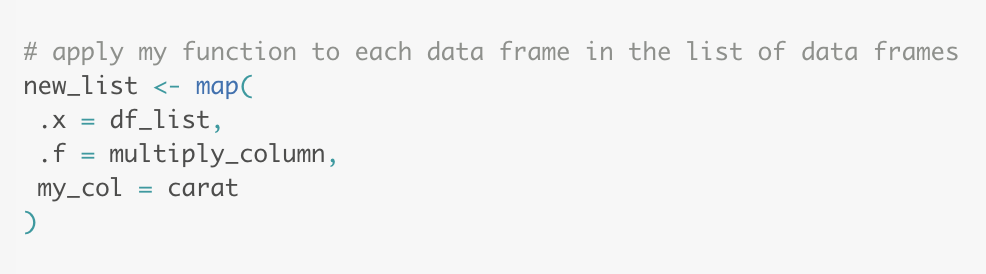
Change multiple data frames inside a list
In R, how to change columns in multiple data frames inside a list using map() not lmap().
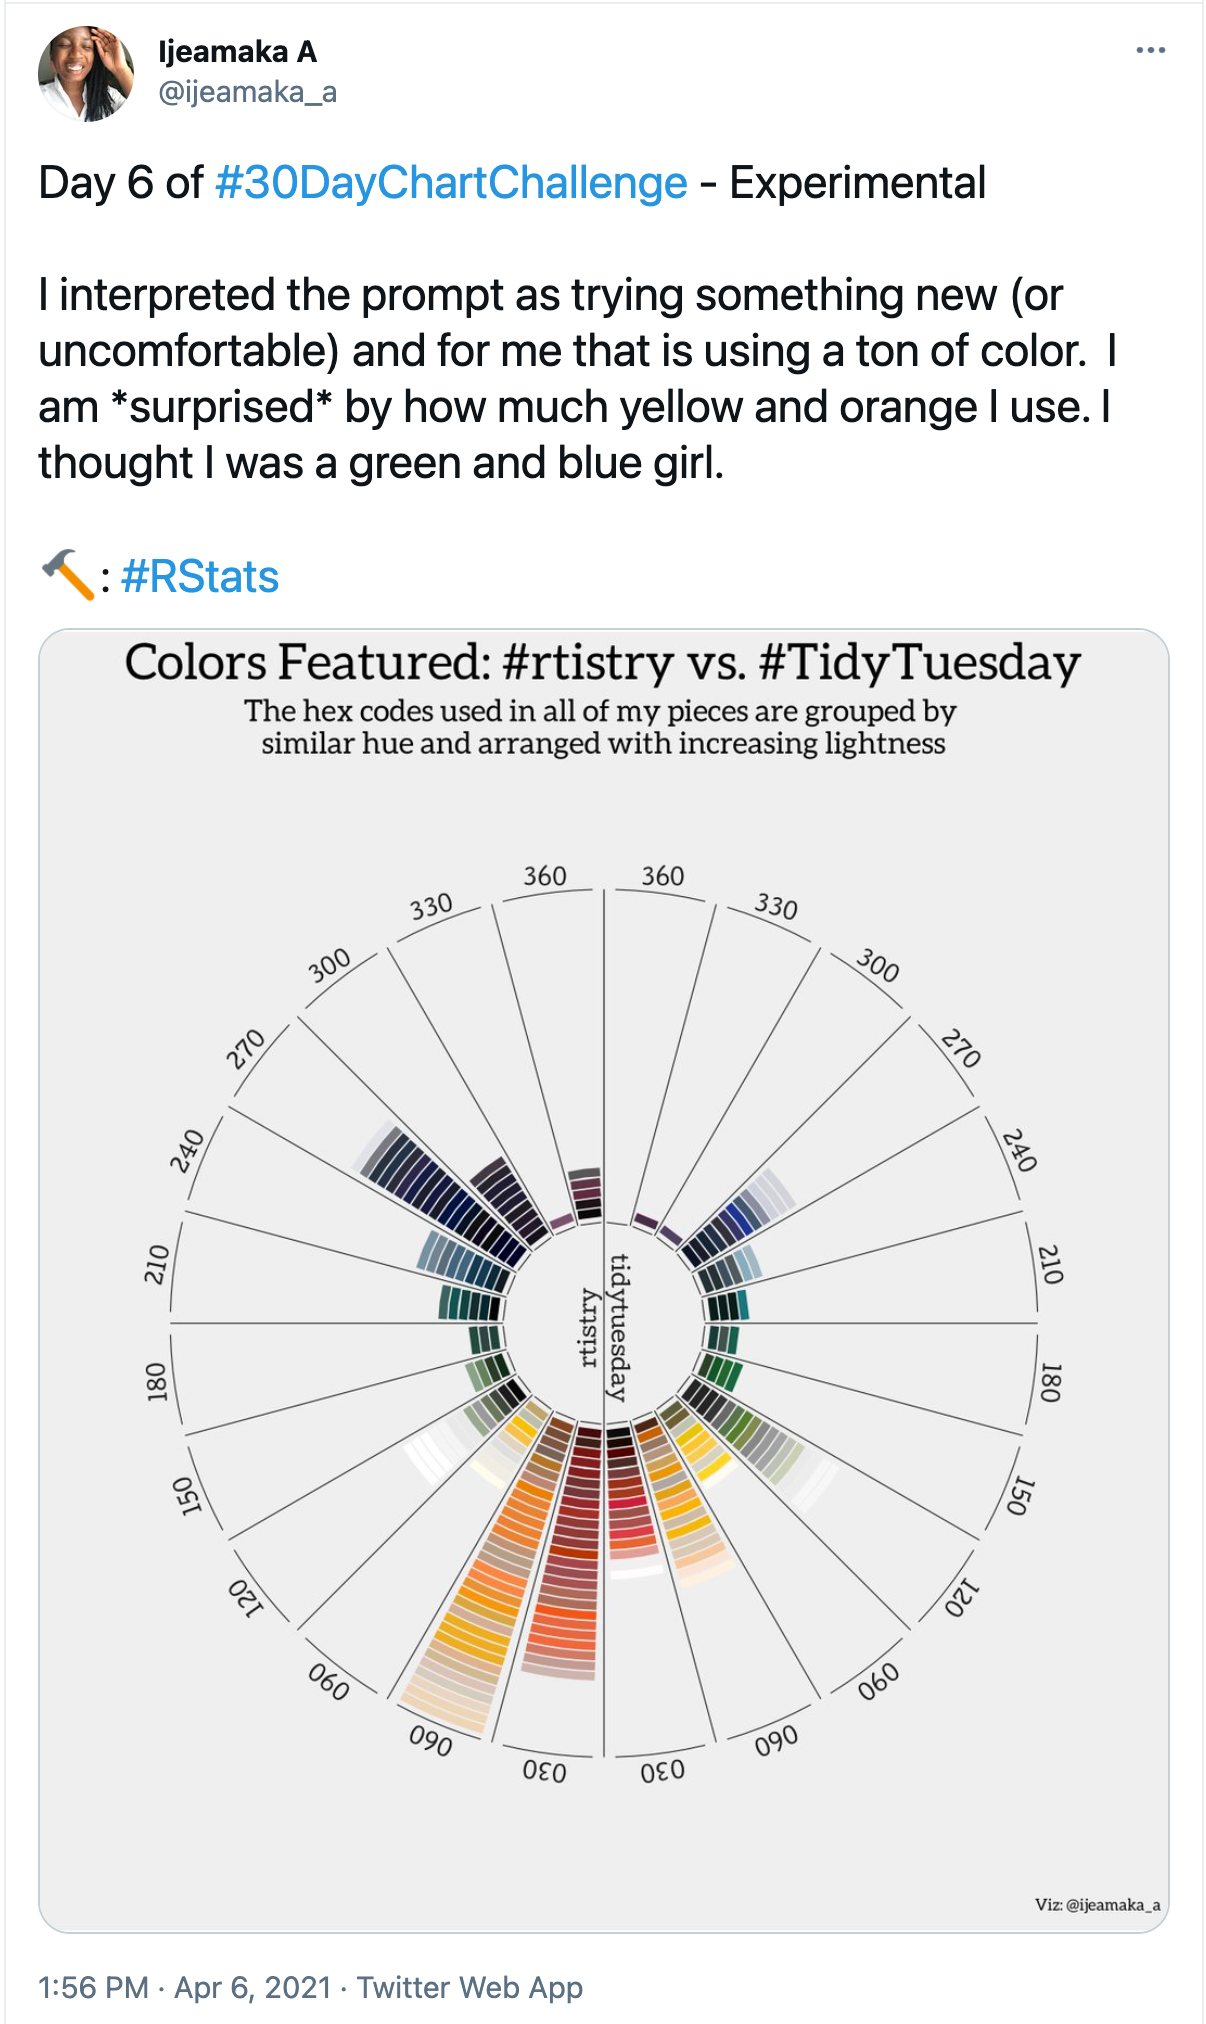
Using Bash to Discover All Hex Codes in All of Your R Scripts
How to analyze all of your R and Rmarkdown files at once using the bash grep utility in a terminal
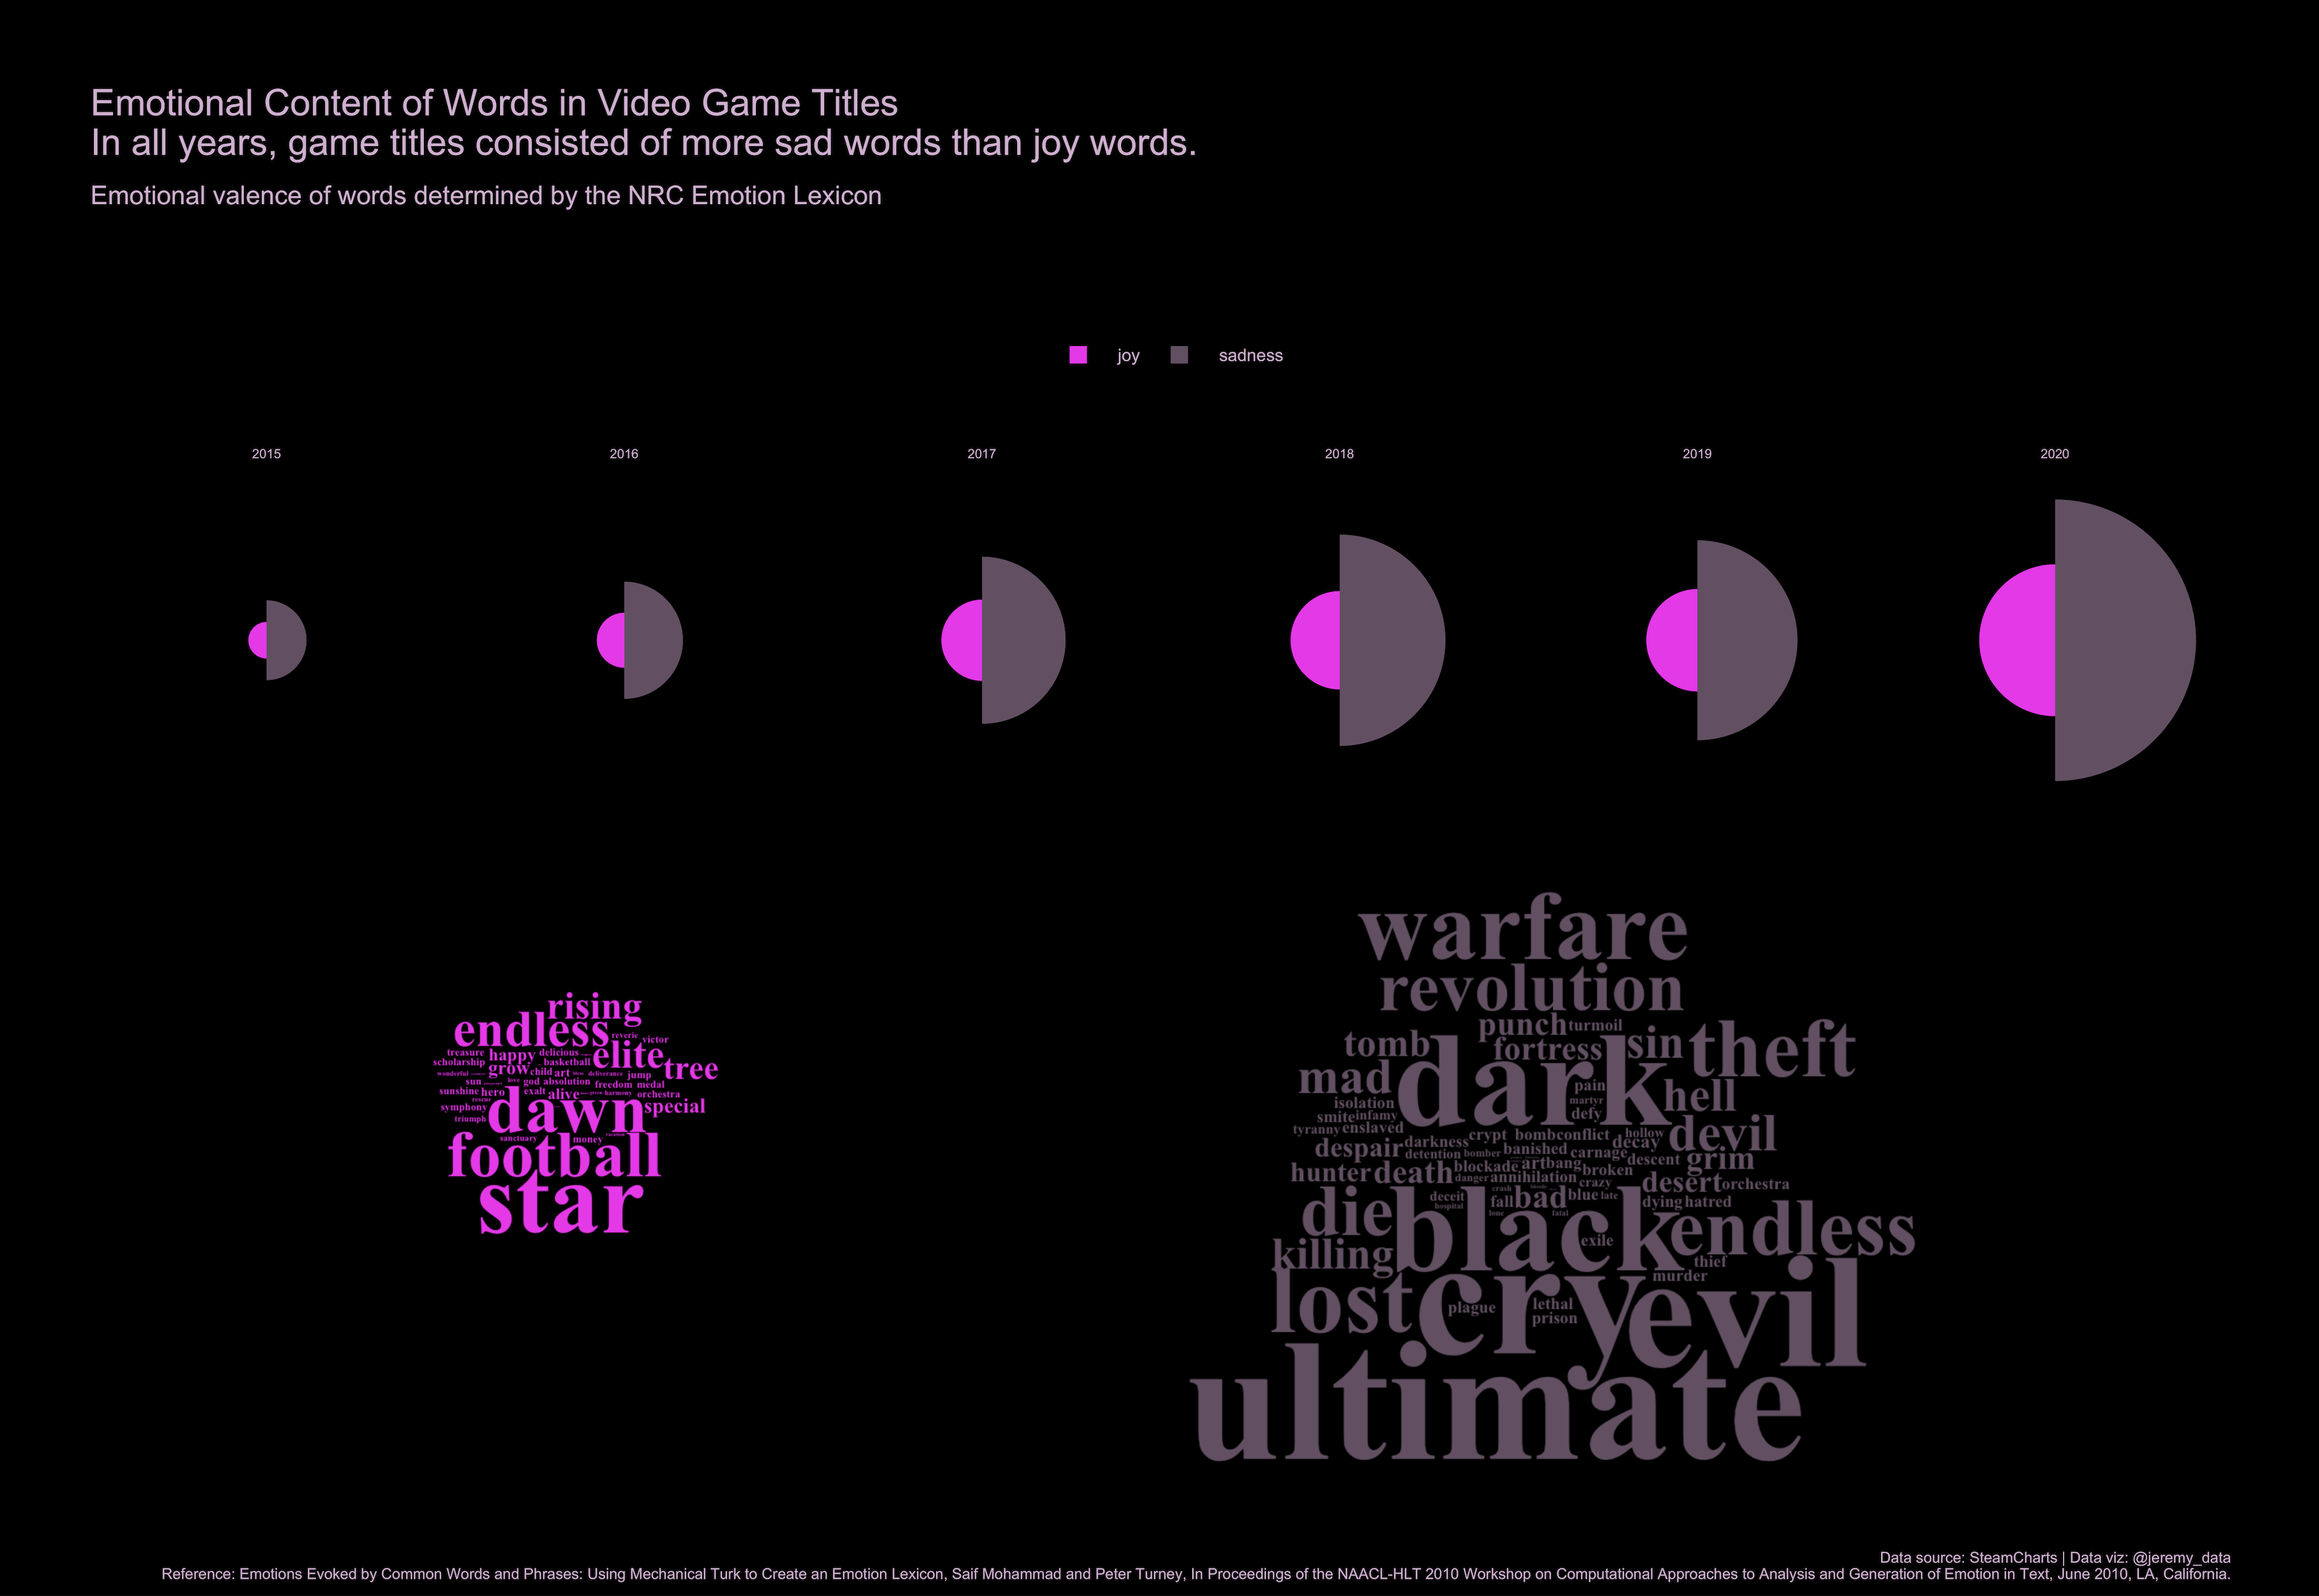
Video Game Title Emotions - a text analysis
Using R to create a data visualization of the emotional content of video game titles
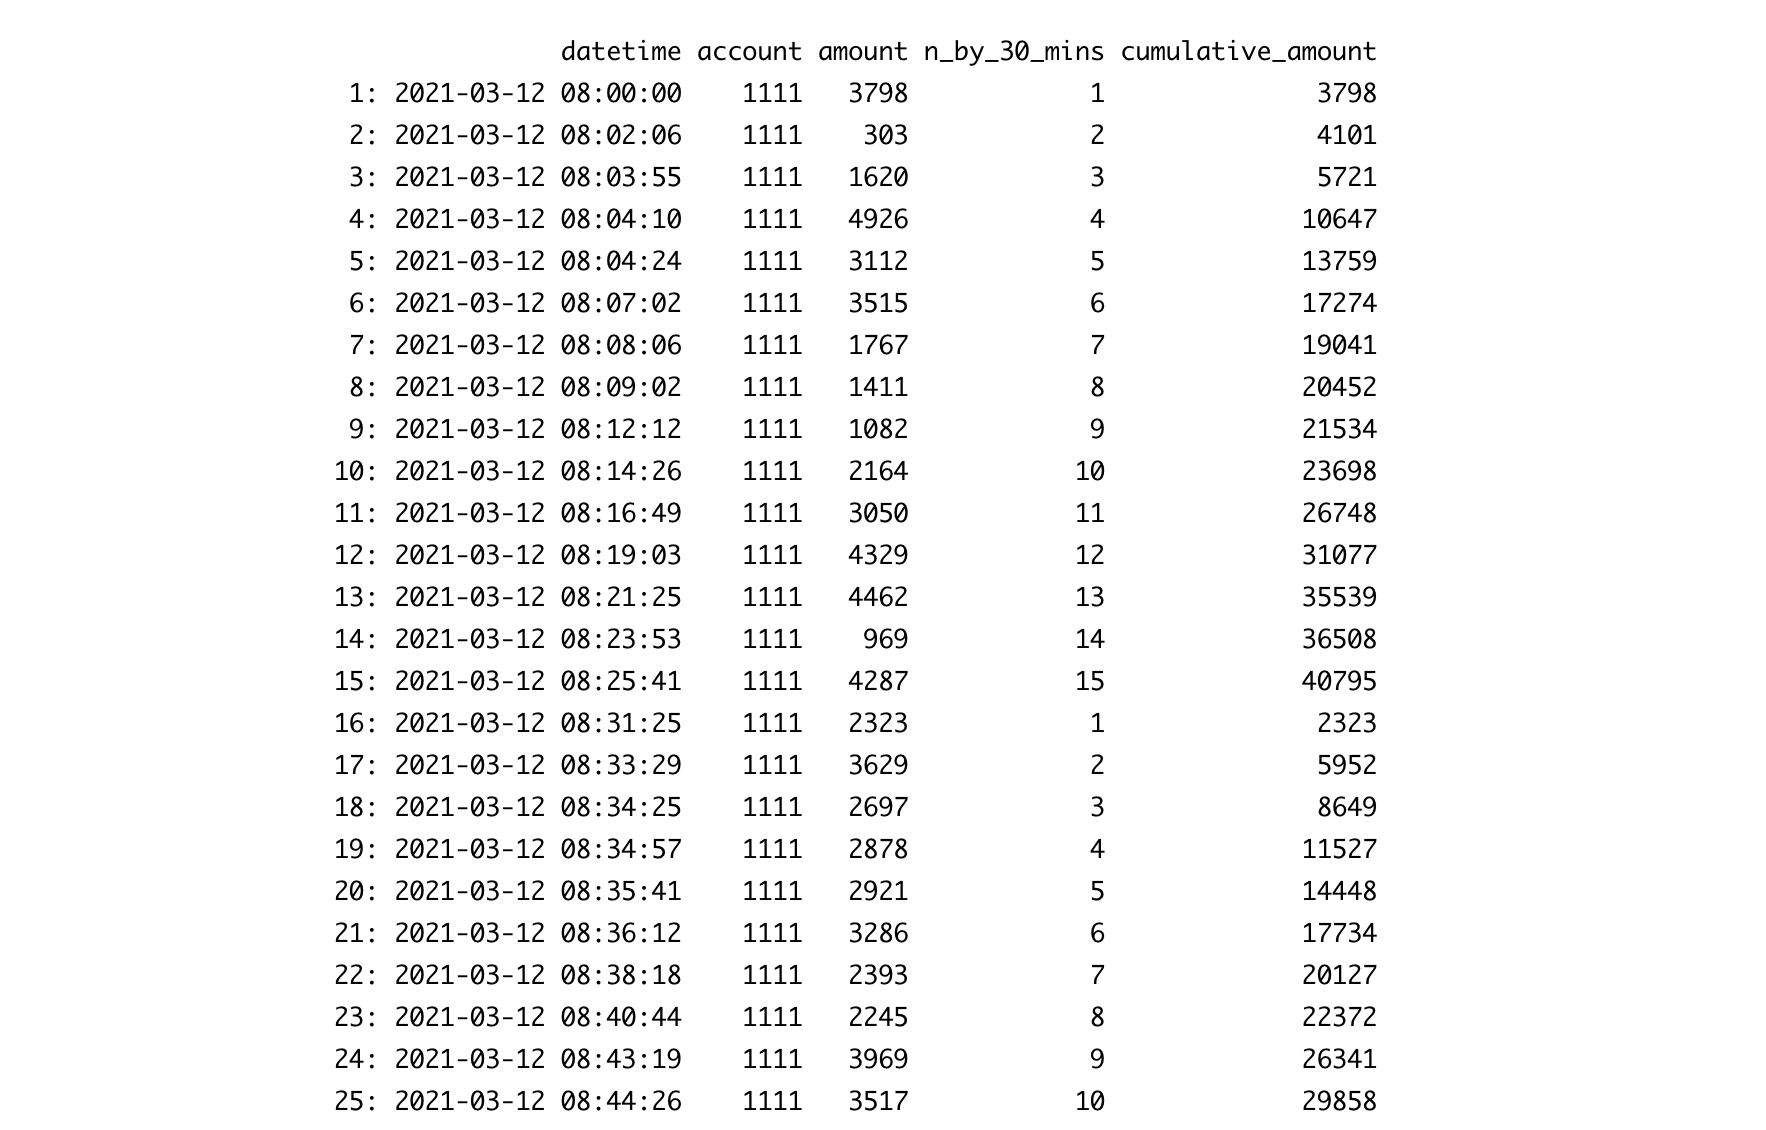
Counts and Cumulative Sums by Group
In a time series, how do I add a counter and cumulative sum that resets every 30 minutes?
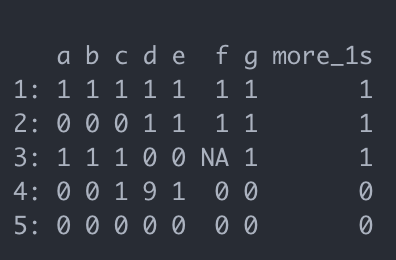
By Row in Base R, Tidyverse, and data.table
Which rows have more 1s than 0s?.
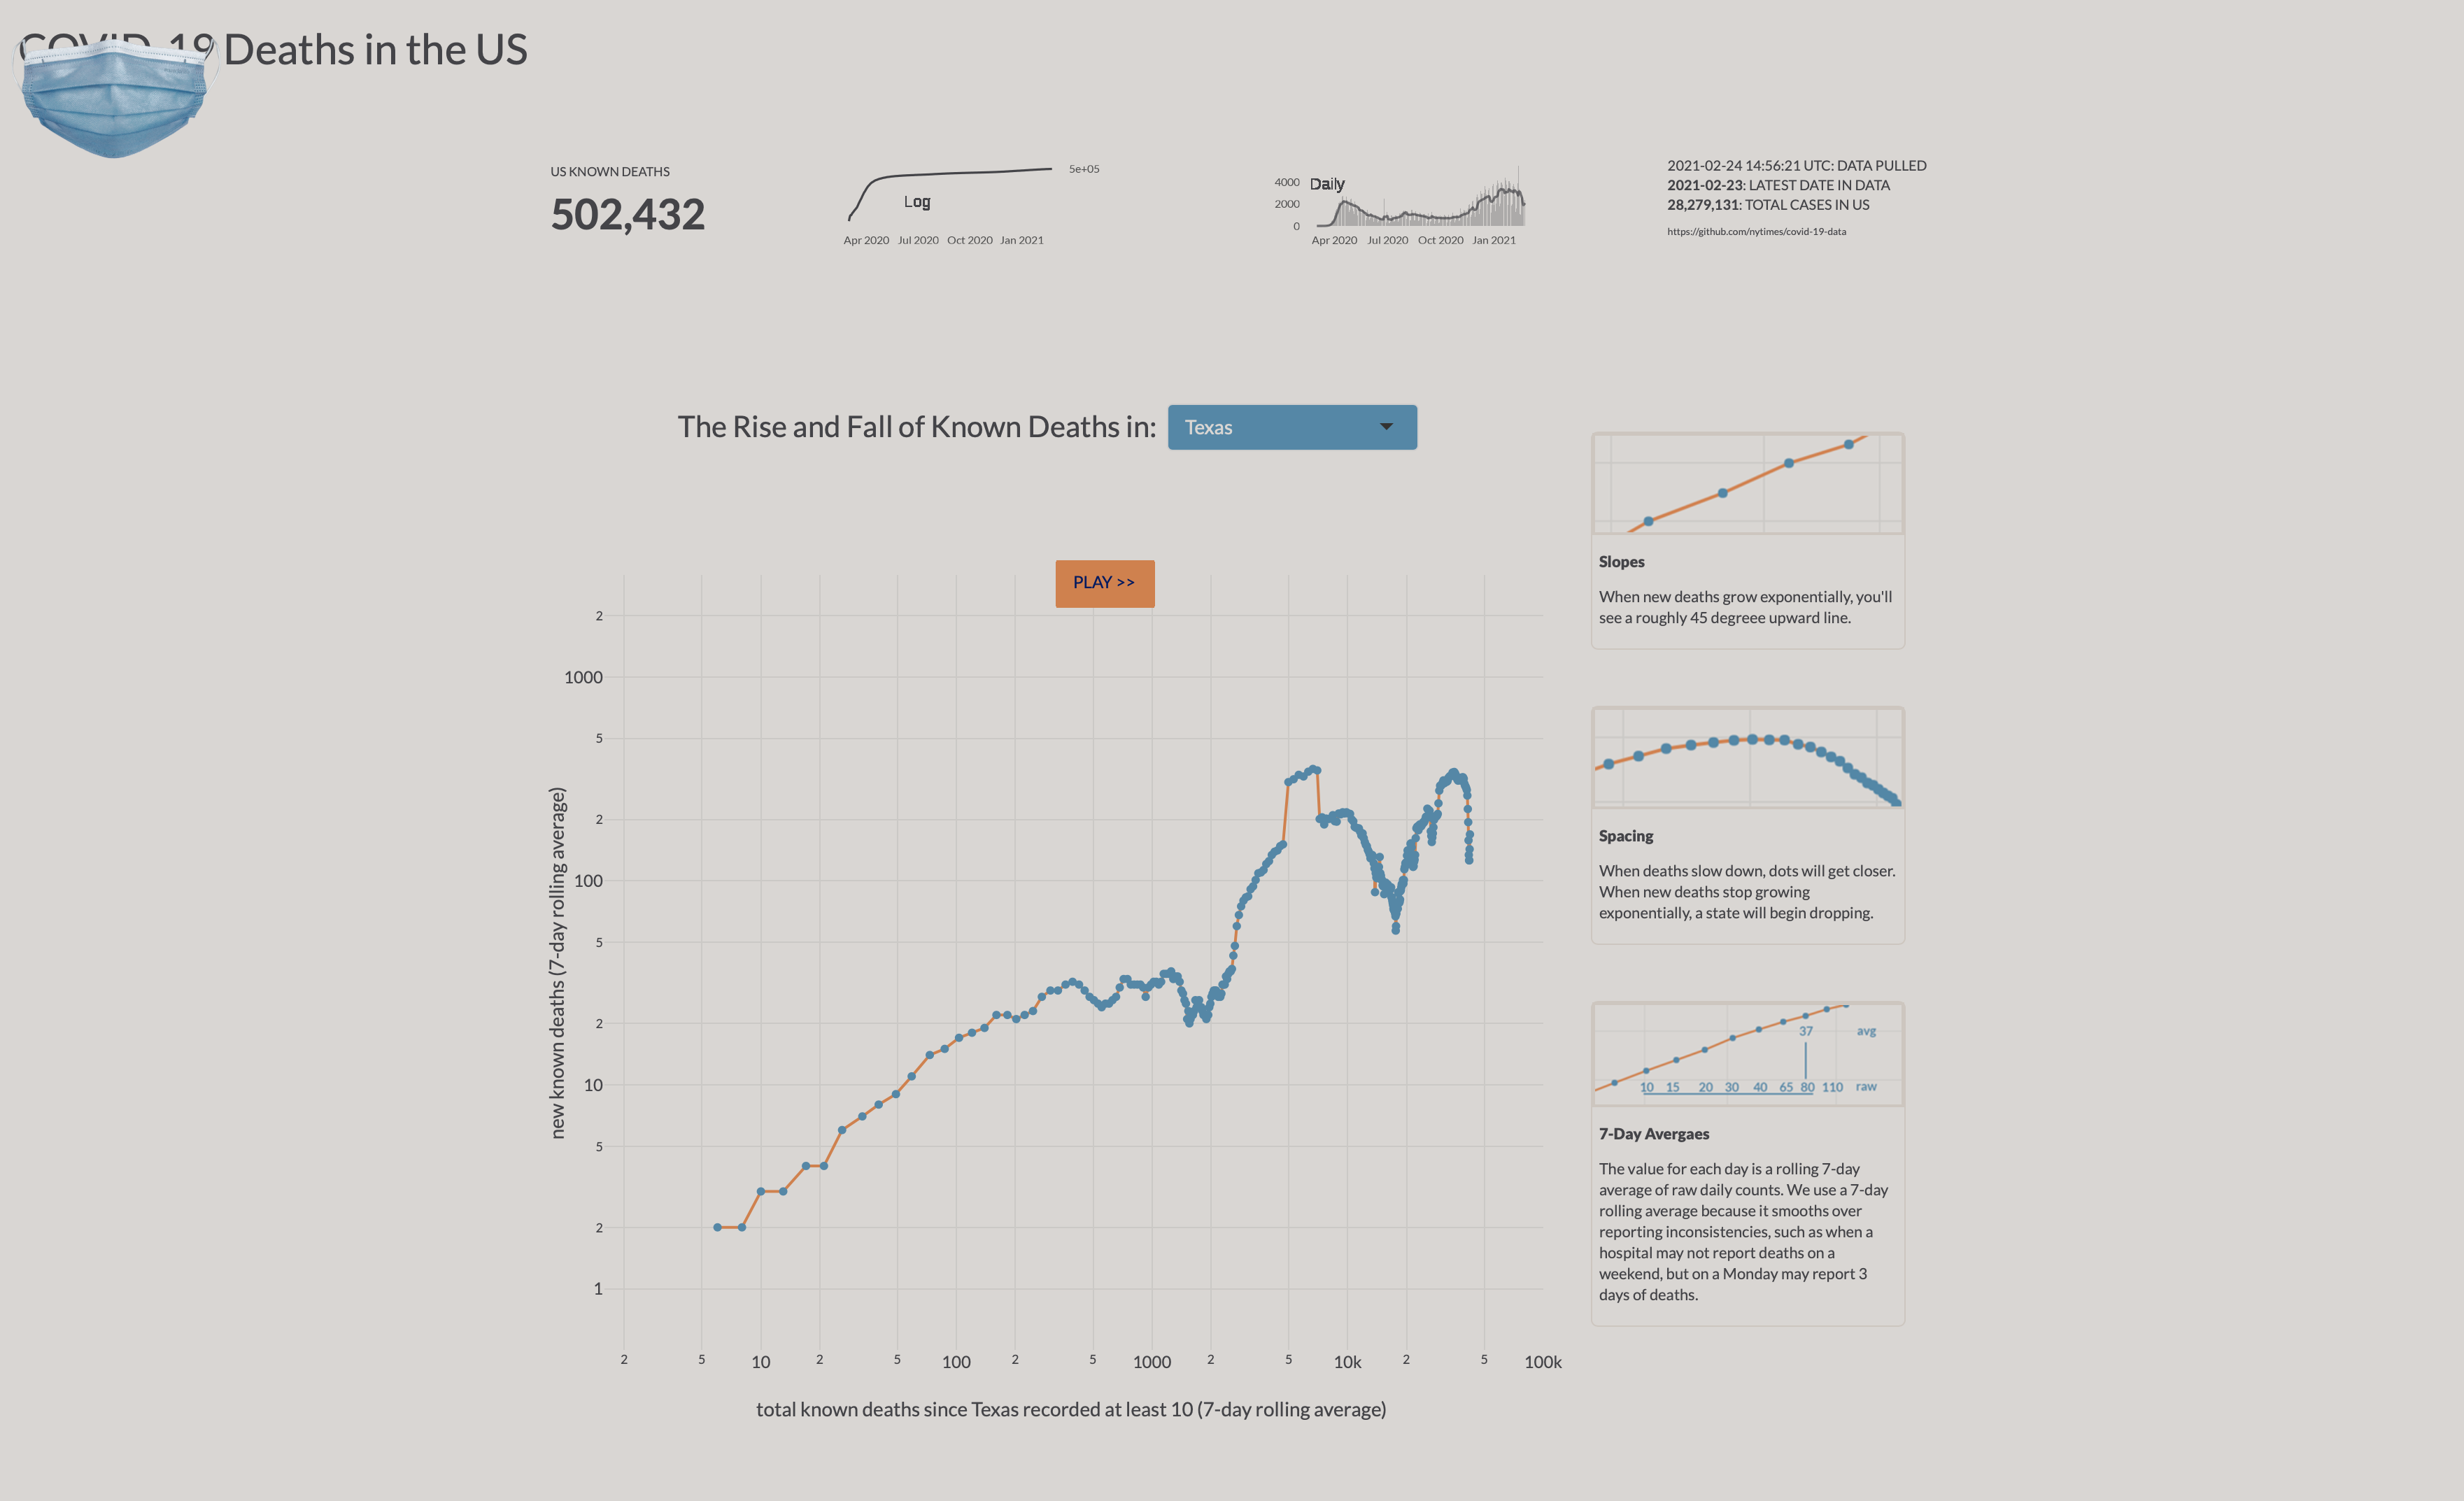
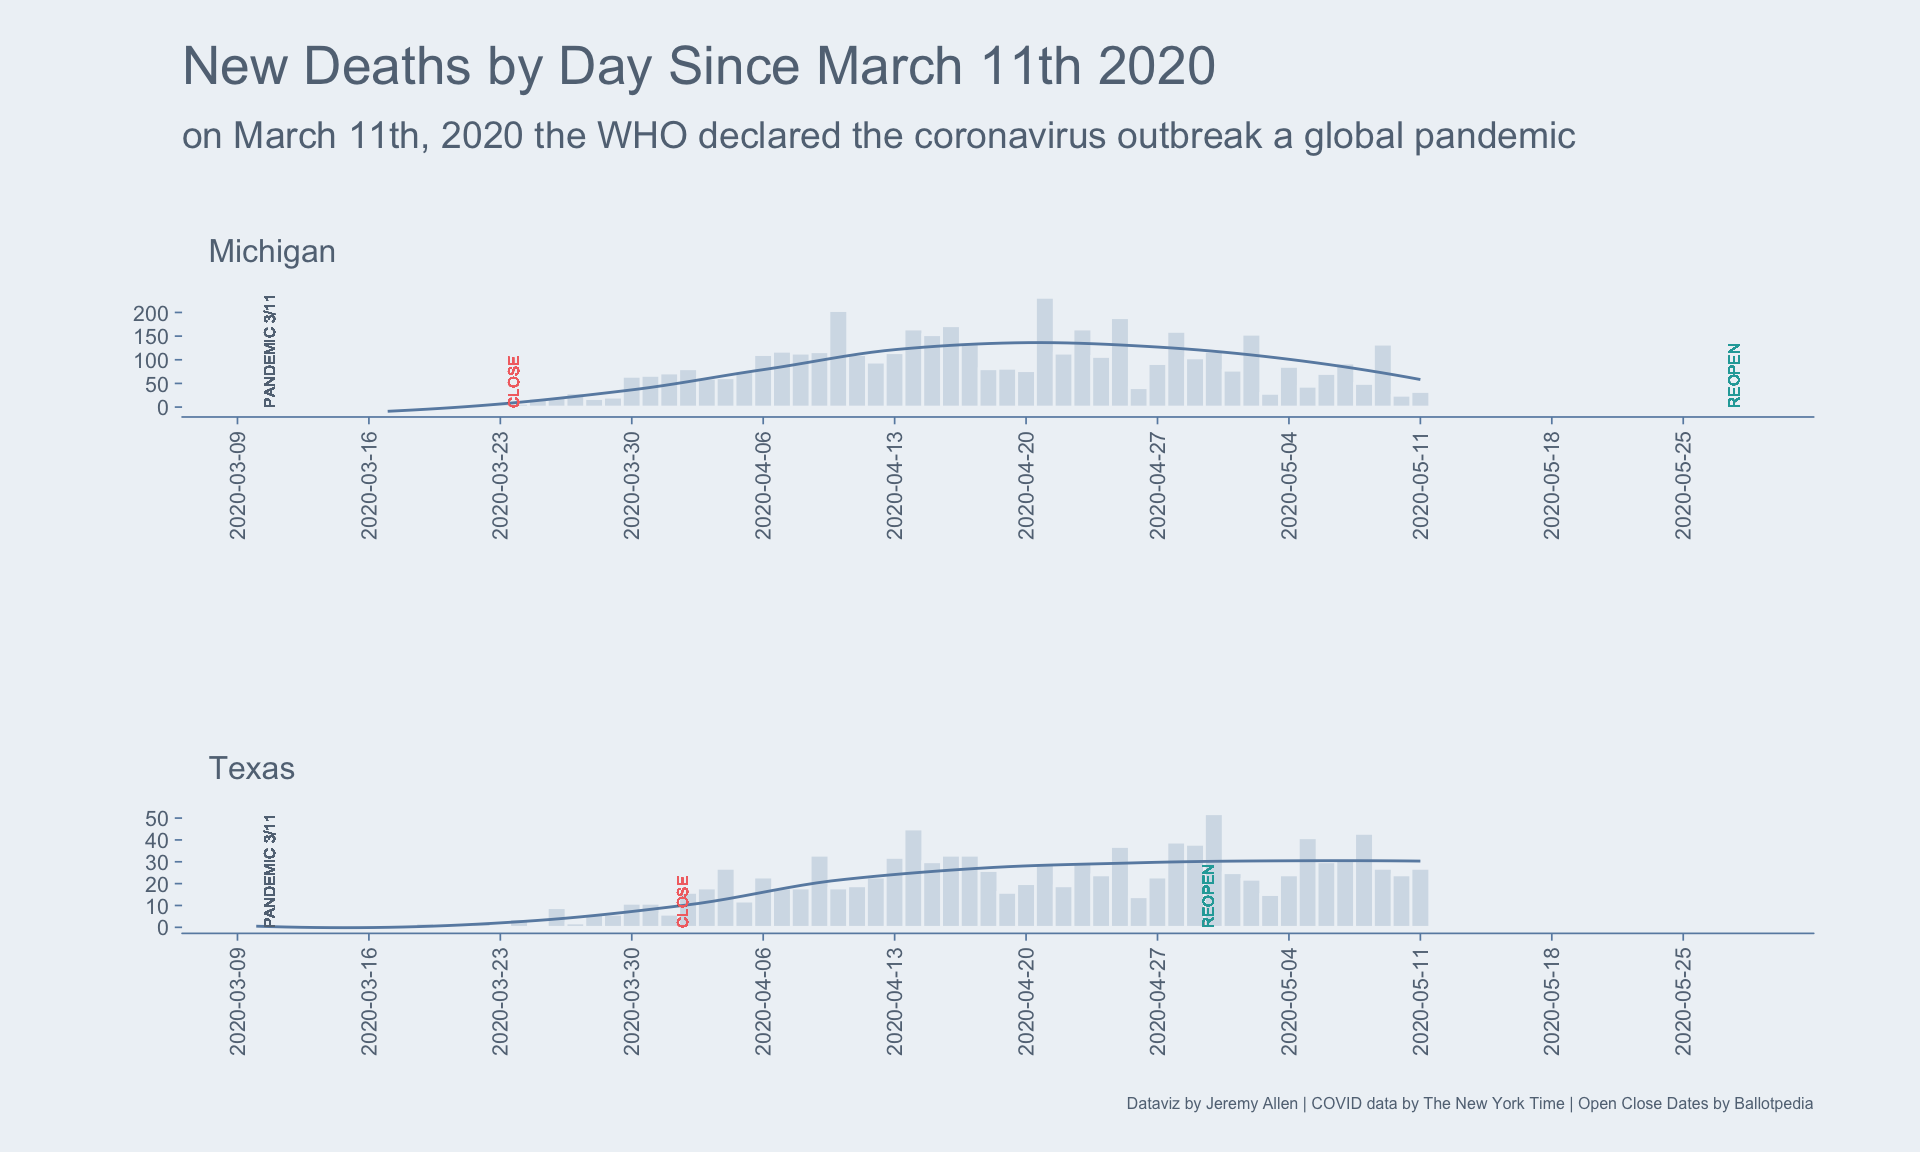
COVID-19 Death Tracking App
An R Shiny app designed for my family to track a single metric and to promote data literacy by including explanatory text with the data visualizations.
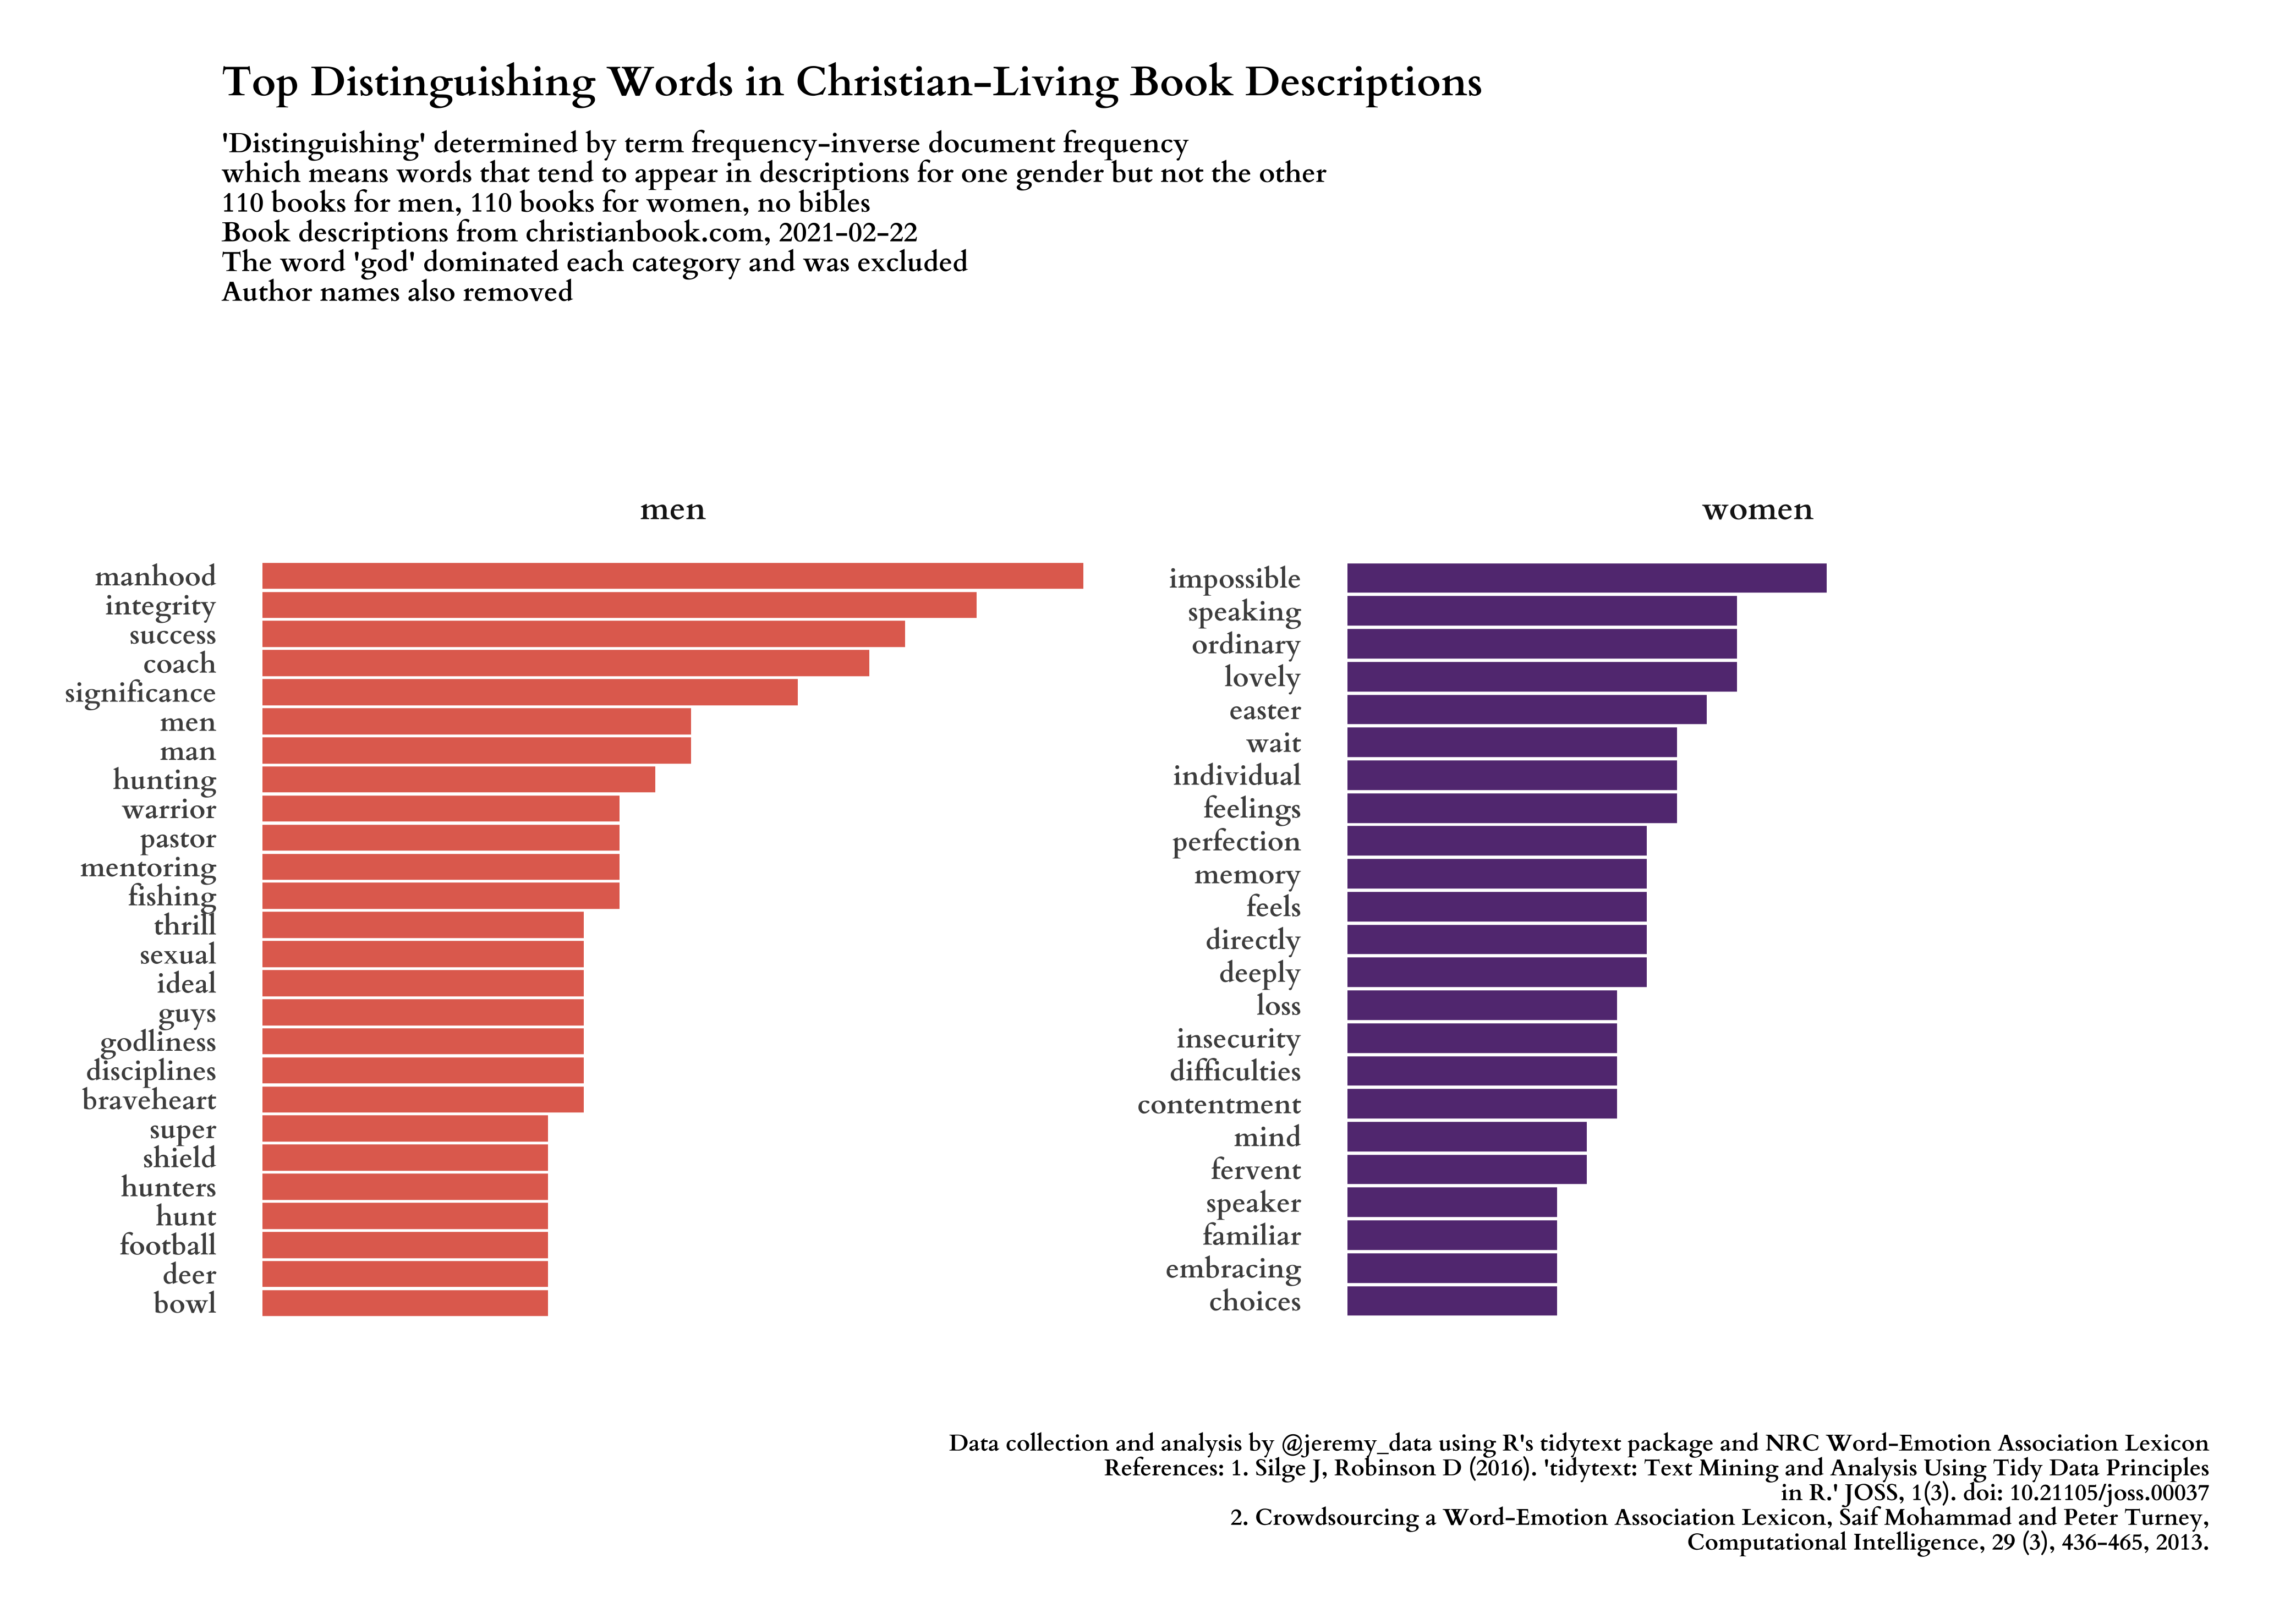
Use R and tidytext to Scrape and Analyze Word Variance in Gendered Christian Book Descriptions
How does word usage vary in Christian book descriptions marketed distinctly for men and women?
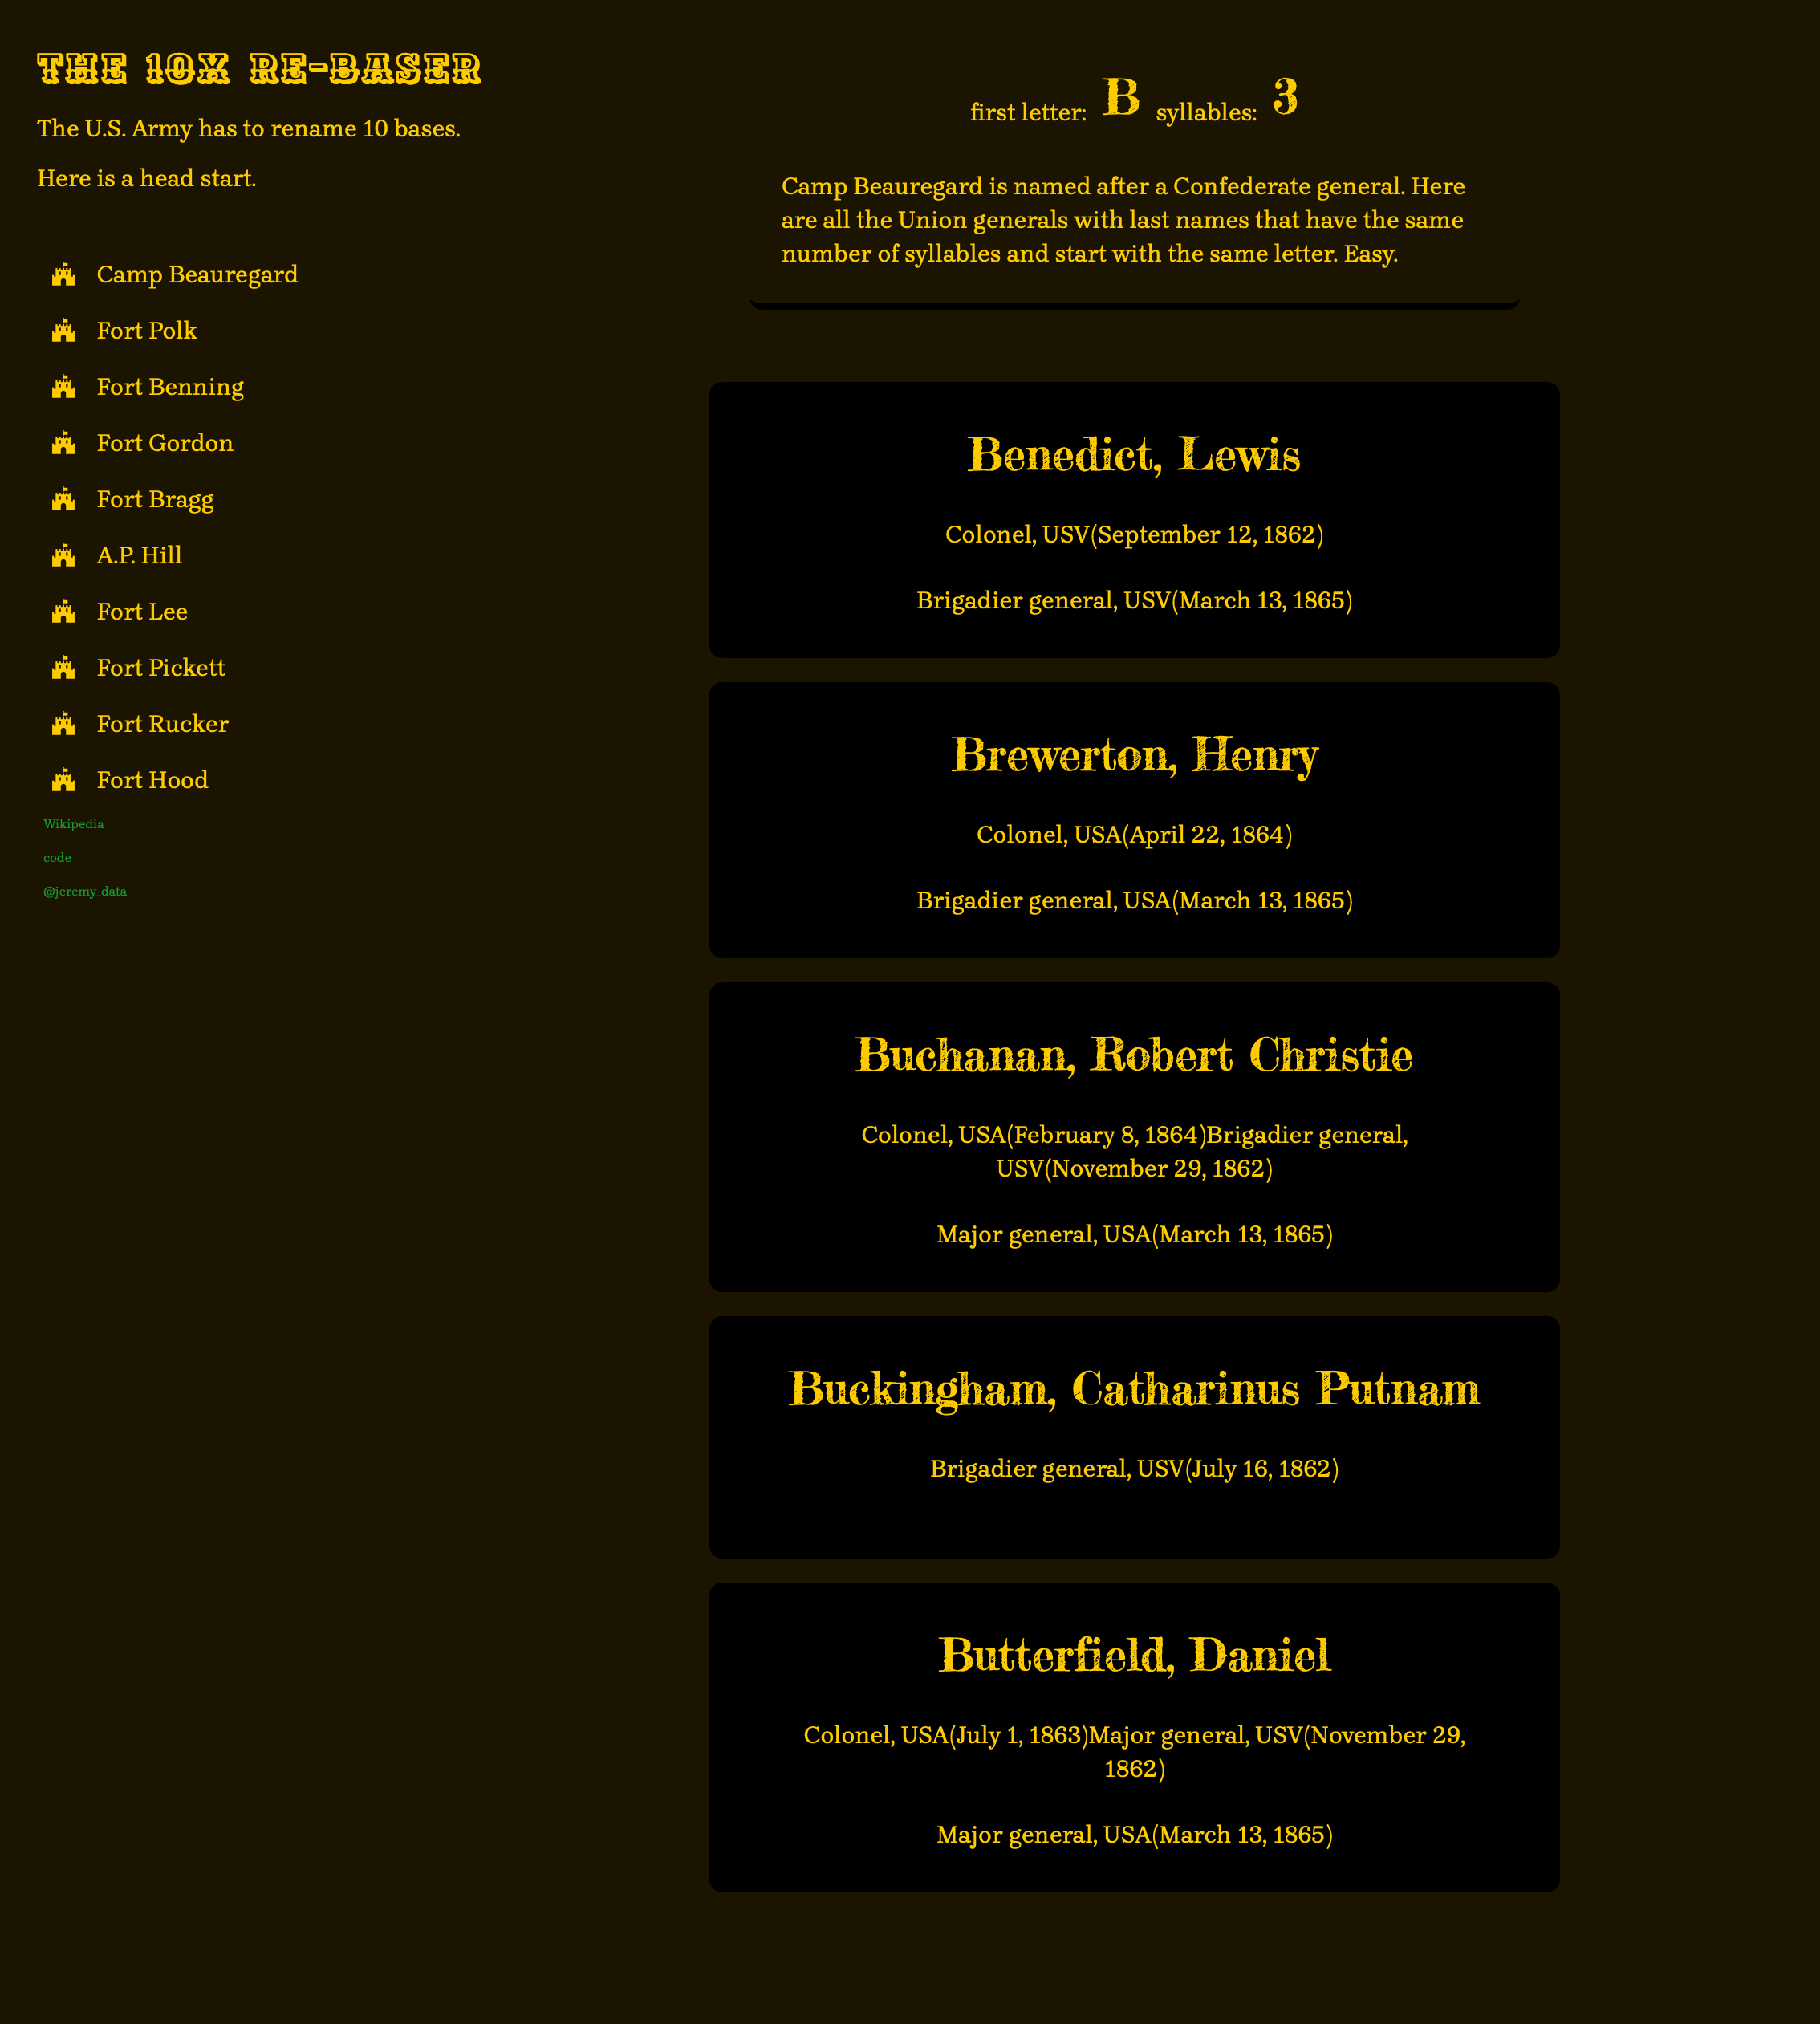
Tidyverse to Army. How Copy? Over.
Helping the Army rename their Confederate-named bases with some help from R's tidyverse, rvest, quanteda, and Shiny
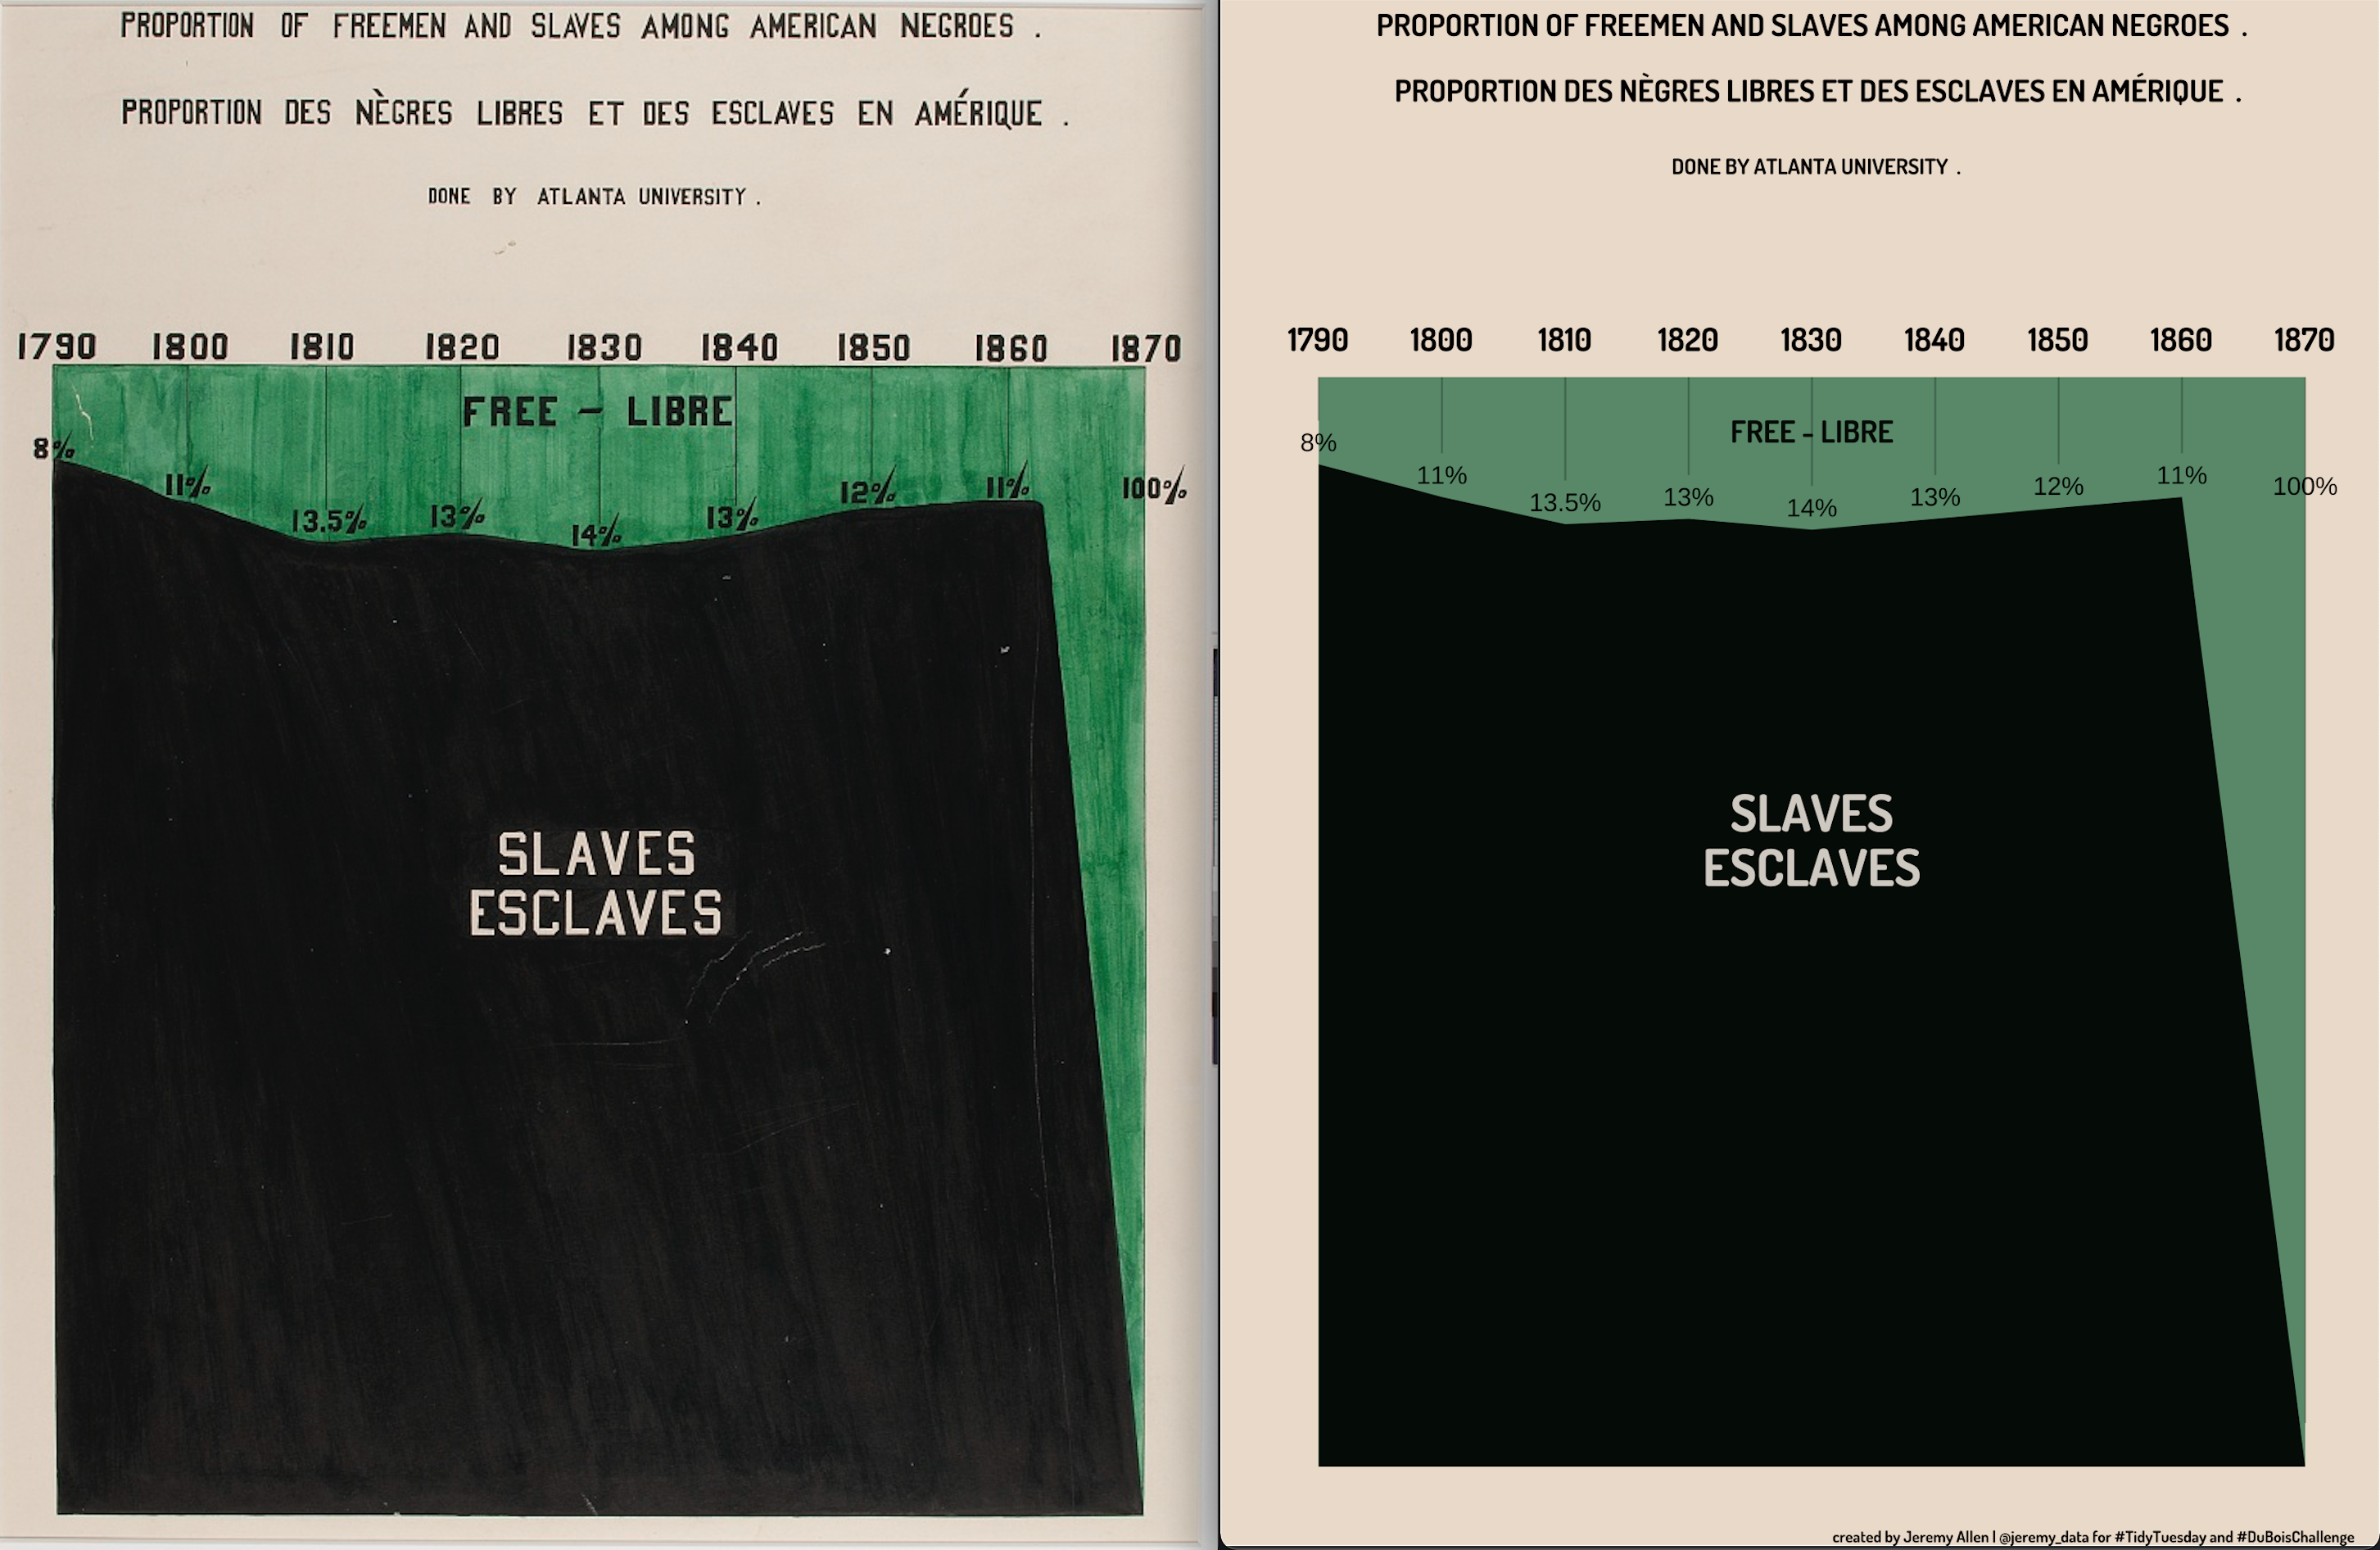
Using R's ggplot2 to recreate a hand-drawn W.E.B. Du Bois data visualization
fine-tuning margins, lables, and annotations
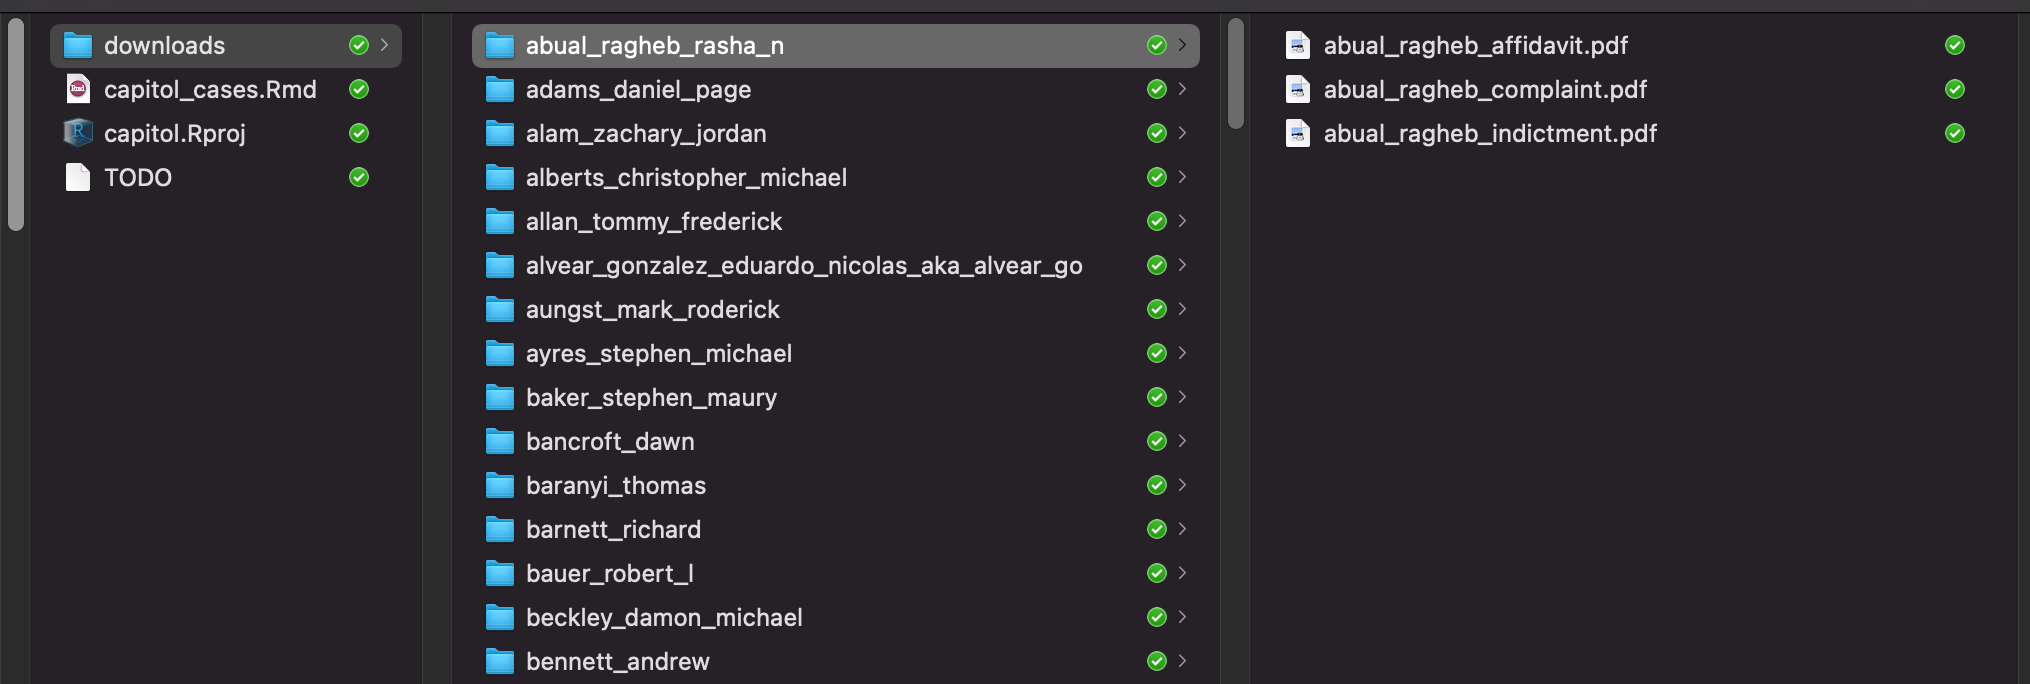
Scrape Hundreds of PDF Documents From the Web with R and rvest
Safely download all complaints, affidavits, and indictments for all capitol attackers
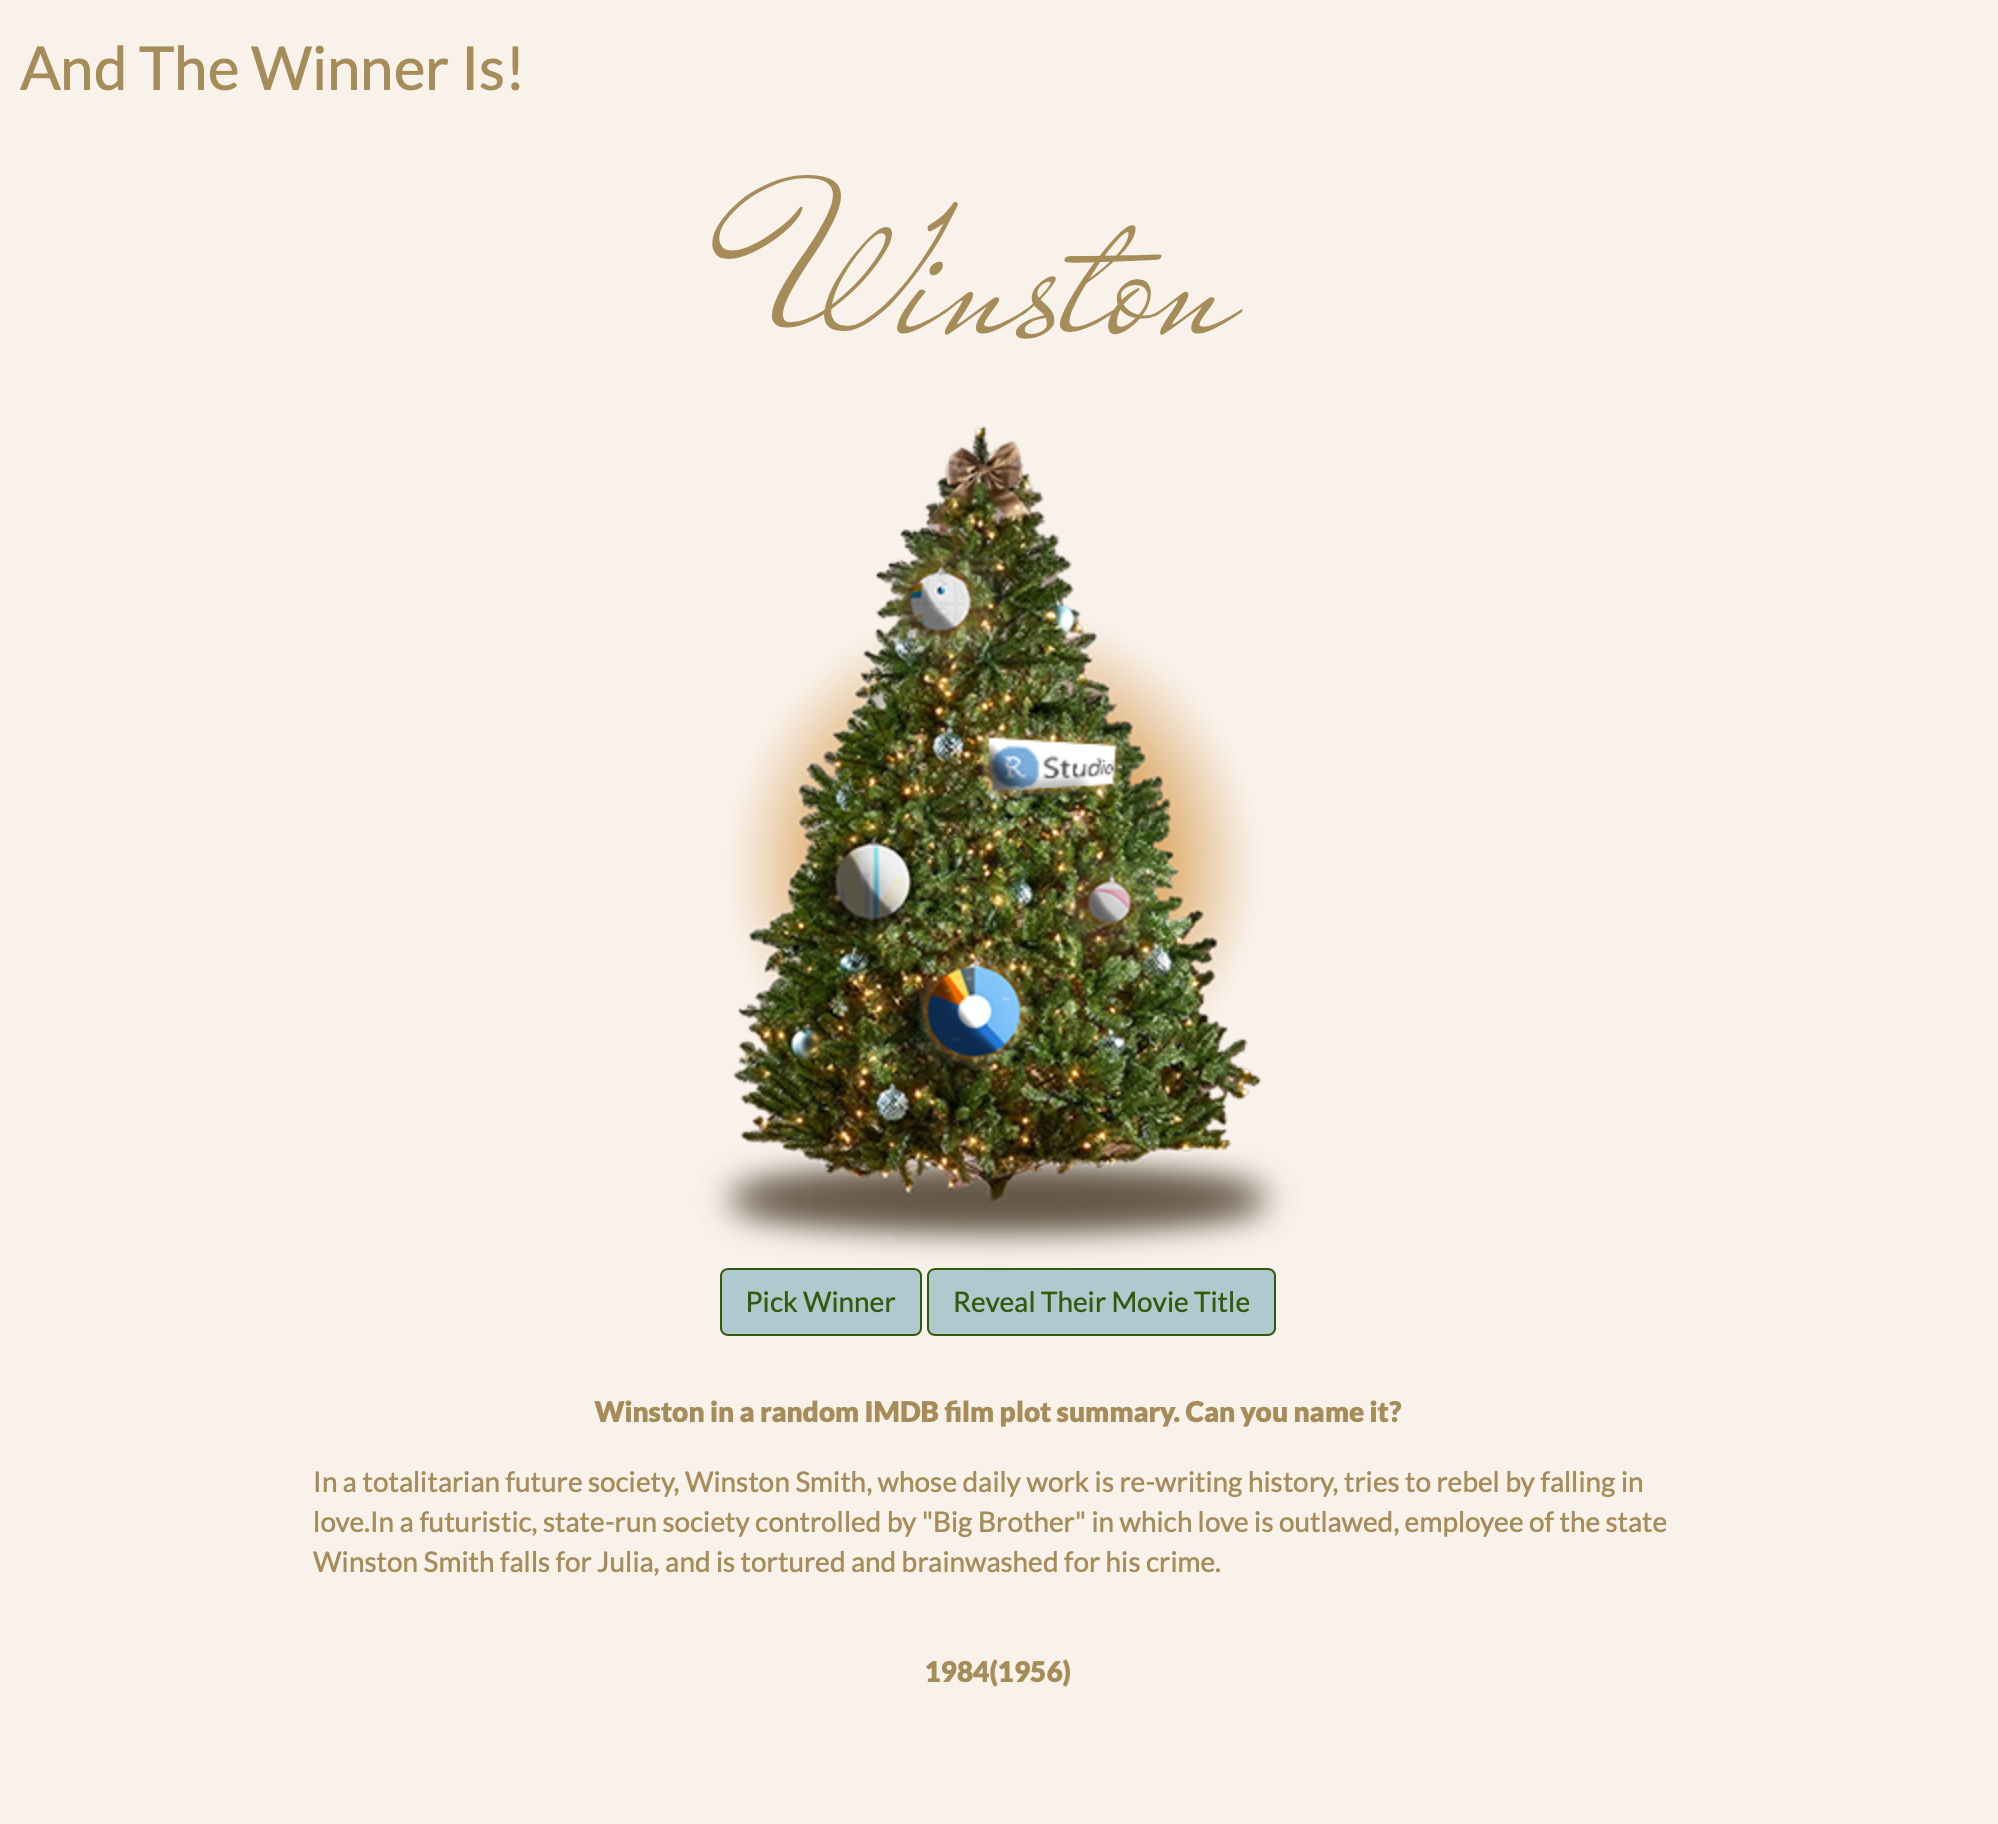
Shiny Holiday Party
Fun Shiny app to draw names at the office party
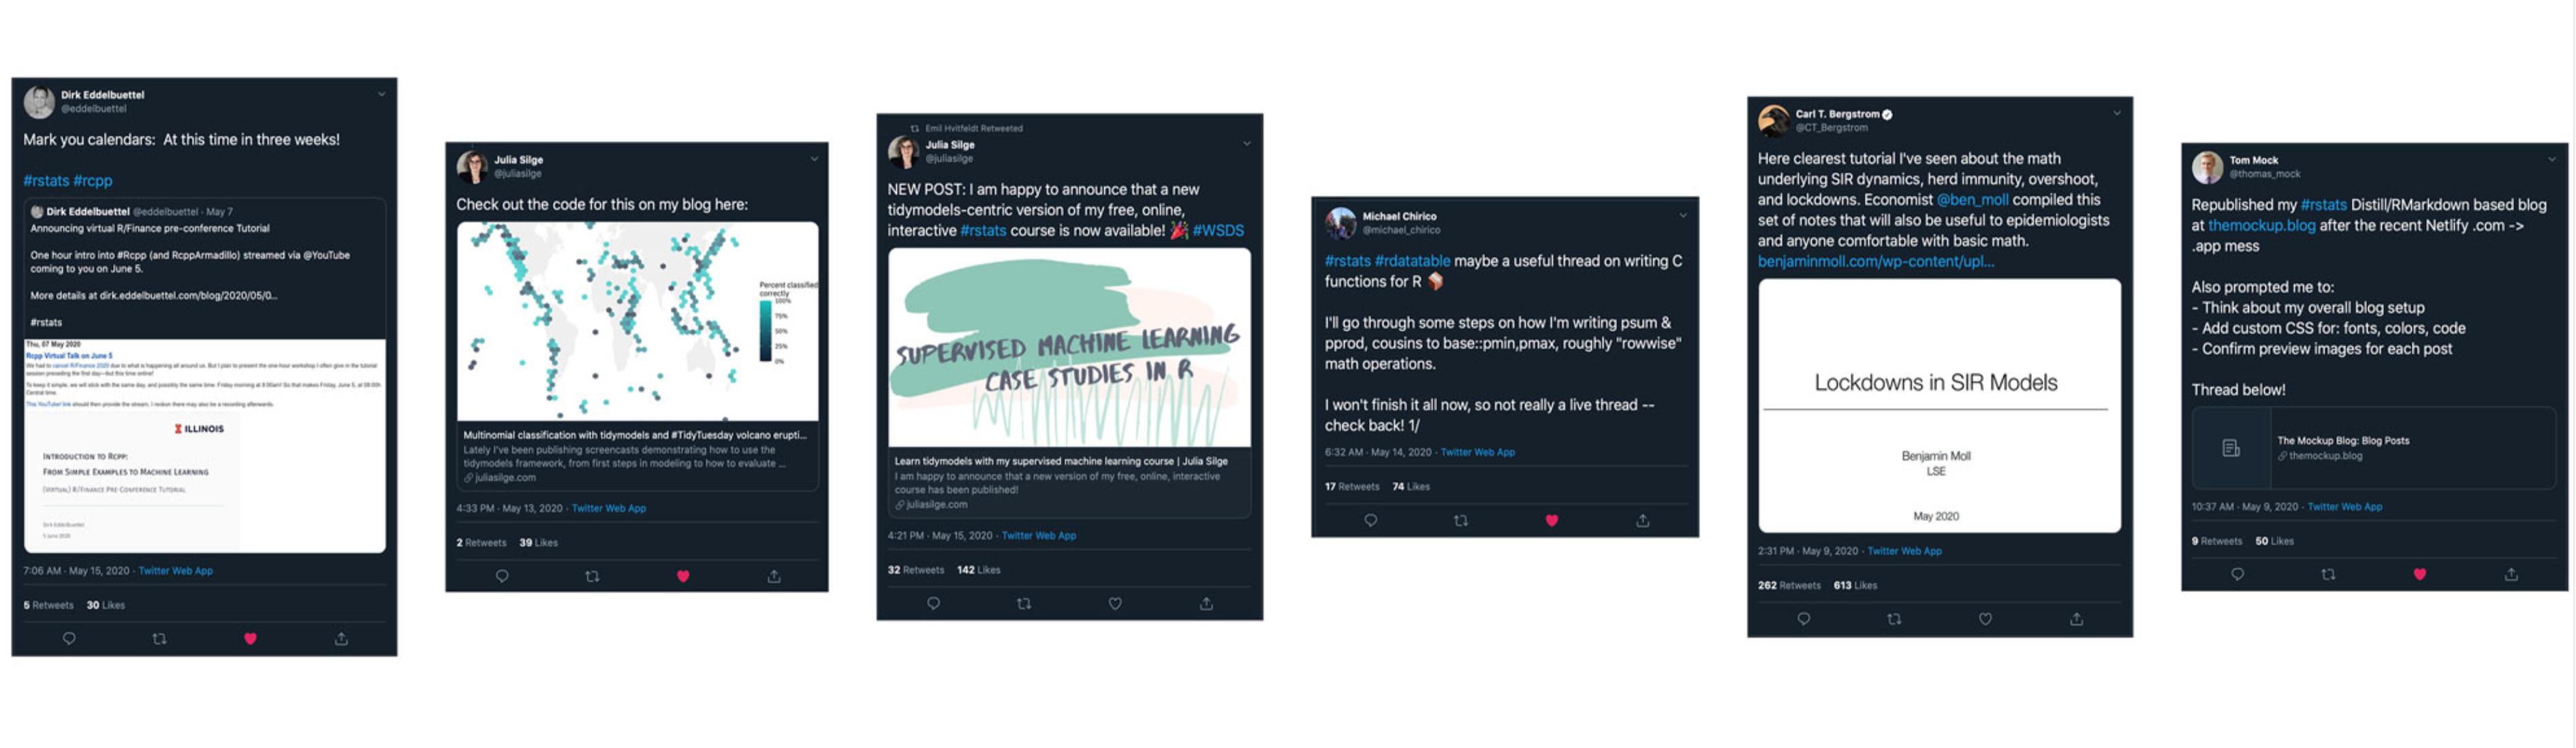
Twitter Bookmarks
Recently bookmarked tweets worth sharing.
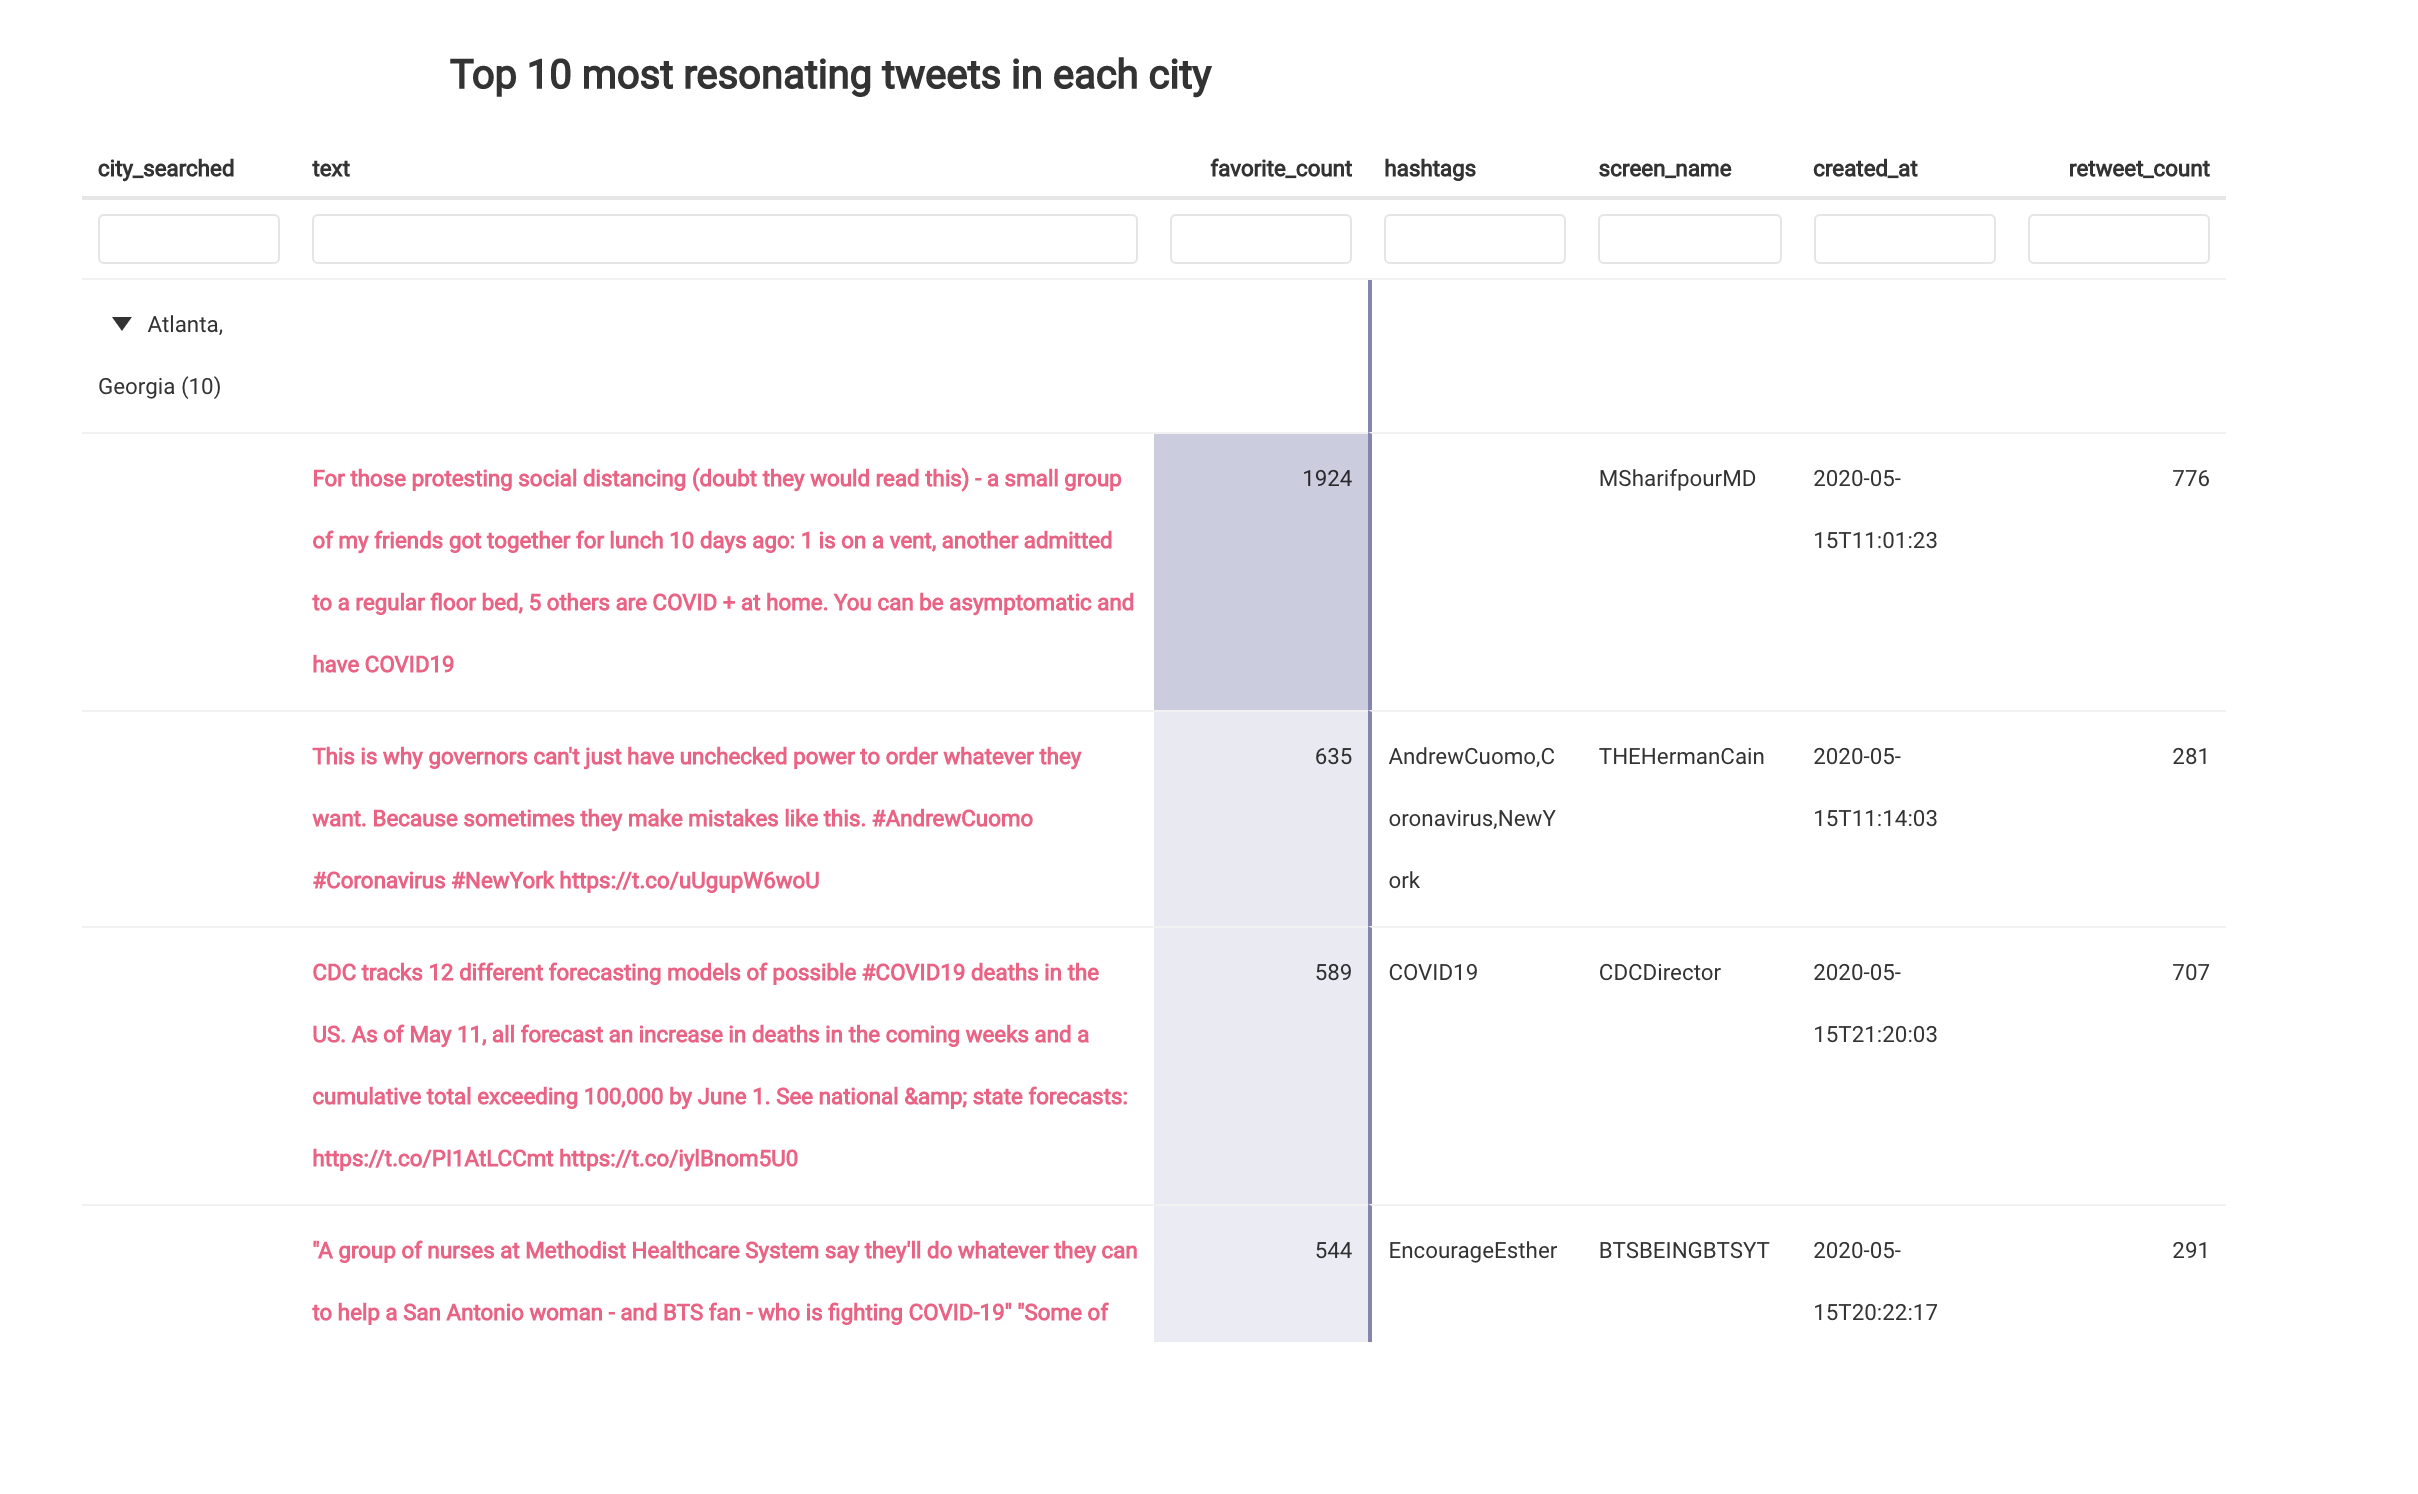
Twitter by Location
Make functions that will gather tweets by keyword in multiple geographic locations, find the most resonating and most activating tweets in each city and present them in a pretty table for reading
Scrape, Clean, Join, Plot
Write a function to scrape an online table, then use data.table to prep it for analysis. Use text from the table to add text annotations in a ggplot2 bar plot.
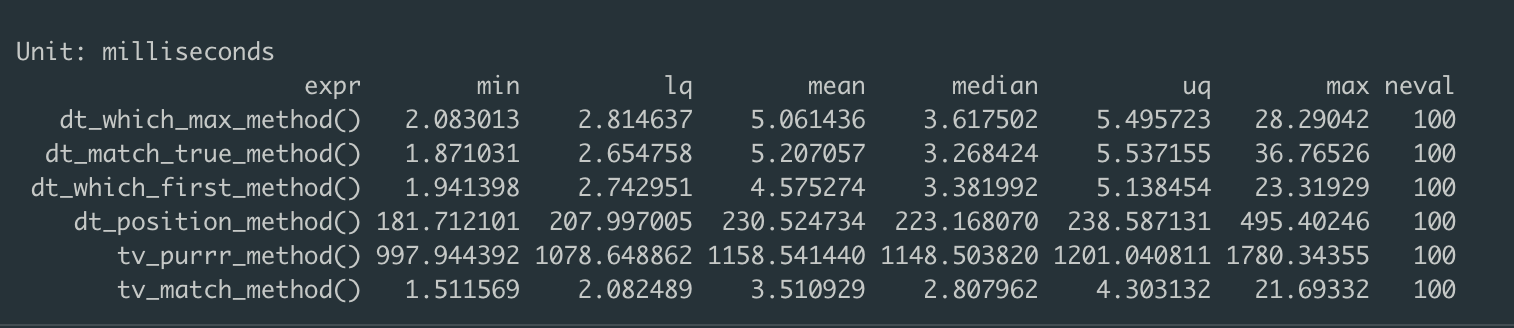
Find Index of First Instance
Find one thing with another thing. We'll speed test various data.table and tidyverse methods for finding the position of the first match and use that to index another column.
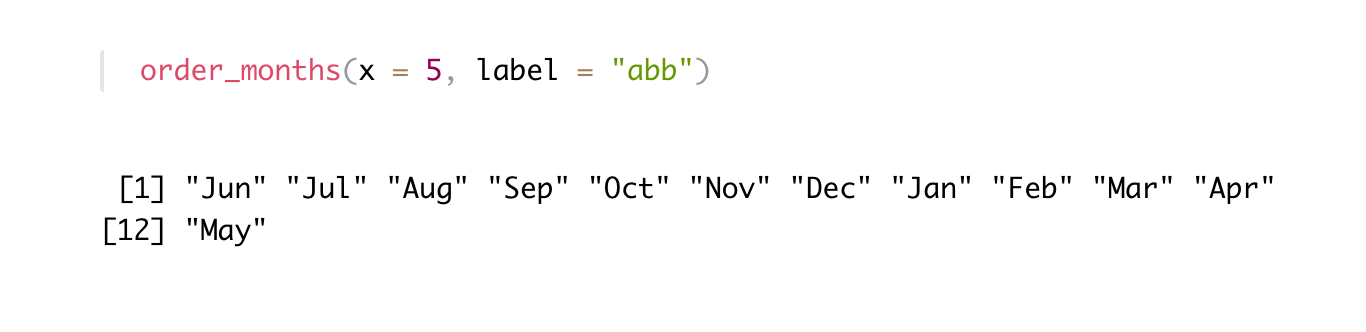
Order Months
Produce a vector of month names ending with the current month.